
TL;DR:
- Playable analytics captures detailed user interactions within ads, not just clicks or impressions.
- Using granular metrics improves creative optimization, audience segmentation, and campaign efficiency.
- Most marketers underutilize playable analytics, missing opportunities for data-driven growth.
Playable ads already outperform standard display formats on most key performance indicators, yet a surprising number of mobile game marketers still rely on surface-level click data to judge their campaigns. The real power lies not in knowing that someone tapped your ad, but in understanding exactly what they did inside it. Playable analytics sits at the intersection of data science and creative advertising, capturing granular user behaviour that standard tracking simply cannot reach. Many professionals conflate it with ordinary ad measurement, which leads to missed optimisation opportunities and wasted budget. This article clarifies what playable analytics actually is, which metrics matter most, and how you can apply it to sharpen your user acquisition results.
Table of Contents
- Defining playable analytics in mobile game marketing
- How playable analytics transforms user acquisition
- Key metrics and frameworks for measuring success
- Putting playable analytics into practice: Real-world examples
- Our take: Why most marketers underuse playable analytics
- Unlock smarter growth with actionable playable analytics
- Frequently asked questions
Key Takeaways
| Point | Details |
|---|---|
| Defines playable analytics | It refers to tracking and analysing real user interactions within playable ads for actionable insights. |
| Transforms user acquisition | Helps optimise creative and targeting, driving deeper engagement and lower acquisition costs. |
| Key metrics to focus on | Engagement rate, playthrough rate, and completion rate are essential for success. |
| Data-driven campaigns win | Marketers using playable analytics outperform those relying on clicks and impressions alone. |
Defining playable analytics in mobile game marketing
With confusion surrounding its true definition, it is crucial to first clarify exactly what playable analytics is and the core data it provides.
Playable analytics tracks granular user-level behaviour within playable mobile ads. Rather than recording a single click event, it captures a continuous stream of interactions: where a user taps, how long they engage, which decisions they make, and whether they reach the end of the experience. This depth of data is what separates it from conventional ad tracking, which typically stops at impressions and click-through rates.
The distinction matters enormously for mobile game marketers. A playable ad is essentially a miniature version of your game, and every interaction within it is a signal. High engagement time suggests the mechanic resonates. A sharp drop at a particular moment indicates friction. Completion rates reveal whether your call-to-action lands at the right emotional peak.
Common metrics captured by playable analytics:
- Engagement rate: The proportion of users who interact meaningfully beyond the first tap.
- Time in ad: Average duration a user spends inside the playable experience.
- Completion rate: Percentage of users who reach the end of the ad flow.
- Level completion: For multi-stage playables, how many users clear each stage.
- In-ad choices: Decisions users make at branching points within the experience.
- Click-through rate (CTR): Final tap to the app store or install prompt.
| Metric | What it tells you | Why it matters |
|---|---|---|
| Engagement rate | Quality of initial hook | Predicts downstream conversion |
| Time in ad | Depth of interest | Guides pacing and length decisions |
| Completion rate | Overall ad effectiveness | Signals CTA placement accuracy |
| Level completion | Stage-by-stage drop-off | Pinpoints friction in ad flow |
| In-ad choices | User preference signals | Informs creative personalisation |
Pro Tip: Use granular session data to map exactly where users abandon your playable. Even a 10% reduction in mid-flow drop-off can meaningfully improve your overall install rate.
How playable analytics transforms user acquisition
Now that we have defined playable analytics, let us explore how it drastically improves the user acquisition process versus standard approaches.
Marketers use analytics from playables to identify best-performing creative elements and fine-tune UA strategies. Without this data, campaign decisions rely on blunt instruments: broad demographic targeting and creative intuition. With it, you can segment audiences by engagement depth, serve different ad variants to different behavioural profiles, and allocate budget with far greater precision.
Consider the difference in practice:
| Approach | Data available | Optimisation capability |
|---|---|---|
| Standard ad analytics | Clicks, impressions, installs | Broad audience targeting |
| Playable analytics | All of the above plus in-ad behaviour | Granular creative and audience refinement |
The practical steps for using this data in your customer acquisition and retention strategy follow a clear sequence:
- Define your KPIs before launch. Decide whether you are optimising for completion rate, install rate, or cost per install. This shapes how you interpret the data.
- Segment by engagement depth. Group users who completed the full playable separately from those who dropped off early. Each group tells a different story about intent.
- Run creative A/B tests. Test two or more playable variants simultaneously. Use analytics to identify which mechanic, visual style, or difficulty level drives higher engagement.
- Iterate on the data, not assumptions. Replace underperforming elements based on actual drop-off points, not guesswork.
- Scale winners, retire losers. Once a variant consistently outperforms, shift budget towards it and use its characteristics to inform the next creative cycle.
Understanding the cost of acquisition for gaming campaigns makes this process even more urgent. Every inefficient creative drains budget. Playable analytics gives you the evidence to cut waste early.
Pro Tip: Test your playables in smaller, lower-cost markets first. Use the analytics to identify your top-performing variant before scaling spend into premium markets.
Key metrics and frameworks for measuring success
Once you have robust analytics in place, understanding which metrics drive results becomes the next critical step.
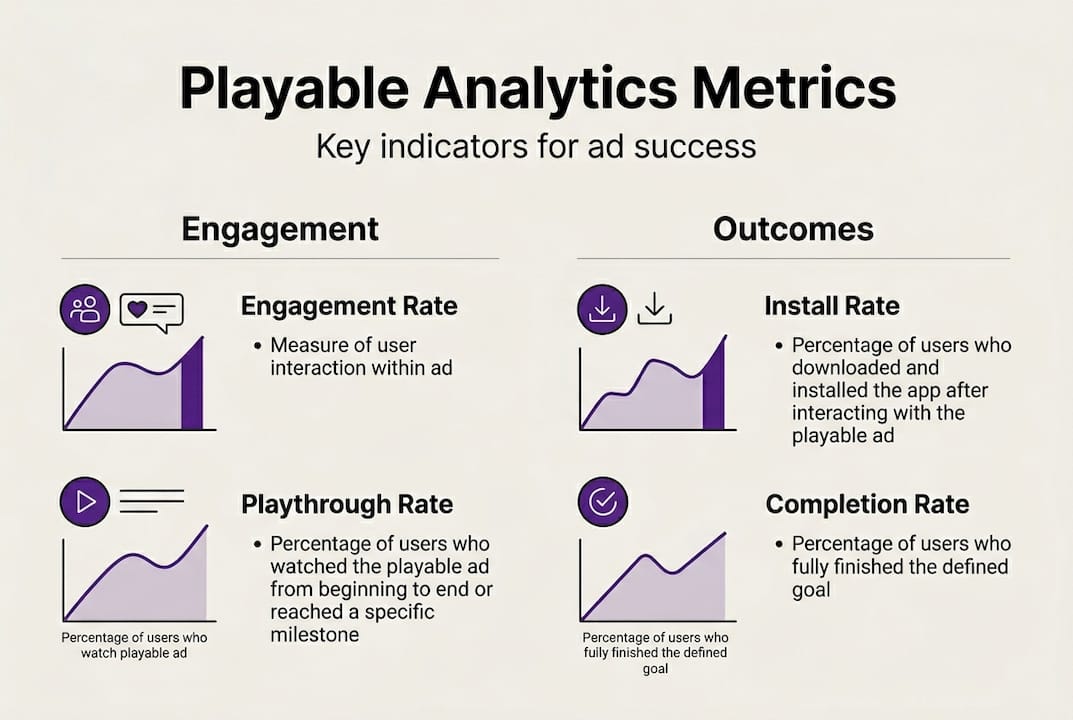
Not all metrics carry equal weight. Engagement rate, playthrough rate, and level completion are essential for understanding ad impact. These three, taken together, form a reliable picture of whether your playable is working as intended.
The metrics that matter most:
- Engagement rate shows whether your opening hook is strong enough to pull users in.
- Playthrough rate measures how many users experience the full ad journey.
- Decision points reveal user preferences and can inform both creative and game design.
- Completion rate confirms whether your CTA arrives at a moment of genuine enthusiasm.
- Funnel drop-off analysis pinpoints the exact stage where users lose interest.
Analytics-backed creatives are consistently linked to higher conversion rates. This is not coincidental. When creative decisions are grounded in behavioural data rather than aesthetic preference, the resulting ad speaks more directly to what users actually respond to.
“The most effective playable ads are not the most visually impressive ones. They are the ones built around what the data says users want to experience.”
A practical framework many UA teams use is the engagement funnel. Map each stage of your playable to a metric, then identify where the steepest drop occurs. If 80% of users engage initially but only 30% reach the CTA, the problem lies somewhere in the middle of the experience, not at the start or end.
One common pitfall deserves attention. Low completion rates are frequently misread as failure. In reality, a challenging playable that filters out casual users and retains high-intent players can be highly efficient. The metric only becomes a problem when the users who do complete the ad fail to convert to installs. Always read completion rate alongside install rate, not in isolation.
Top-quartile engagement scores are associated with up to 40% higher install rates, which underscores why investing in the analysis of these interactive marketing benefits pays dividends beyond the ad itself.

Putting playable analytics into practice: Real-world examples
Theory is vital, but it is successful implementation that drives ROI. Let us turn to real-world use cases and actionable steps.
Playables refined through analytics lead to measurable improvements in both engagement and cost efficiency. A typical scenario looks like this: a mobile game studio launches three playable variants targeting a puzzle game audience. Variant A features a simple one-tap mechanic. Variant B introduces a swipe gesture with a time limit. Variant C offers a branching narrative choice. Without analytics, the team would pick a winner based on CTR alone. With analytics, they discover that Variant C drives the lowest CTR but the highest post-install retention, because the users it attracts are genuinely aligned with the game’s core loop.
Here is a step-by-step approach to implementing this kind of test-and-learn cycle:
- Set up your analytics framework. Choose a platform that captures in-ad events, not just final clicks. Confirm that your playable is instrumented to log each interaction.
- Define your primary and secondary KPIs. Primary might be install rate. Secondary could be day-one retention or cost per install.
- Launch in a controlled environment. Use a limited budget in a test market to gather statistically meaningful data without large spend.
- Analyse funnel drop-offs weekly. Do not wait for a campaign to end before reviewing. Early signals allow mid-flight adjustments.
- Apply findings to the next creative iteration. Use the drop-off data to restructure the ad flow, adjust difficulty, or reposition the CTA.
Leveraging AI in mobile game marketing can accelerate this cycle considerably. AI-assisted tools can automatically surface which creative elements correlate with high engagement, reducing the manual analysis burden on your team.
Pro Tip: Use AI tools to rapidly iterate playable variants based on early analytics feedback. What used to take weeks of creative cycles can now be compressed into days.
Our take: Why most marketers underuse playable analytics
Having covered the practical and strategic sides of playable analytics, it is time for a candid reflection on why so many industry professionals still get it wrong.
The uncomfortable truth is that most UA campaigns are still optimised for traffic volume rather than interaction quality. Teams celebrate high impression counts and low CPMs while leaving the richest data, the detailed ad analytics insights captured inside the ad itself, largely unexamined. This is not laziness. It is a structural habit inherited from an era when display ads offered no behavioural data at all.
The marketers who consistently outperform their benchmarks treat playable analytics as a creative feedback loop, not a reporting obligation. They do not set campaigns live and wait for results. They instrument every element, monitor early signals, and adjust continuously. The data does not just tell them what happened. It tells them what to build next.
Superficial metrics leave real revenue on the table. The biggest growth opportunities in mobile game UA sit inside the funnel, not at the top of it. Shifting attention from reach to depth of engagement is not a minor tactical adjustment. It is a fundamental change in how you think about campaign success.
Unlock smarter growth with actionable playable analytics
Ready to use the advanced insights that playable analytics offers? Here is how you can get started quickly and effectively.
At PlayableMaker, we have built our no-code platform specifically so that UA and marketing teams can create, test, and iterate playable ads without draining developer resources or budget. Understanding playable ads effectiveness starts with having the right creative infrastructure in place, and that means analytics baked in from the start, not bolted on afterwards. Whether you are new to playables or looking to scale an existing programme, our tools give you the data visibility to make every creative decision count. Explore how playable ads work and discover what smarter, data-informed ad creation looks like in practice.
Frequently asked questions
How does playable analytics differ from standard ad analytics?
Playable analytics goes beyond clicks and impressions to capture real in-ad behaviour, measuring user interactions, decision points, and completion rates that standard tracking cannot access.
What are the most important metrics in playable analytics?
Engagement rate, playthrough rate, and level completion are core to playable ad success measurement, alongside in-ad decision points that reveal user intent and preference.
How can marketers use playable analytics to optimise campaigns?
Data-driven creative A/B testing leads to higher campaign performance by identifying which ad elements drive the deepest engagement and the highest post-install quality.
Are there tools that simplify integrating playable analytics?
Easy integration of analytics is now a feature on leading playable ad platforms, offering dashboards and actionable insights that require minimal technical setup to get started.
Recommended
- What is Ad Optimization? Understanding Its Importance – playablemaker.com What is Ad Optimization? Understanding Its Importance
- Step-by-Step Guide to A/B Testing Ads for Mobile Games – playablemaker.com Step-by-Step Guide to A/B Testing Ads for Mobile Games
- 8 Key Ad Performance Metrics for Mobile Gaming Success – playablemaker.com 8 Key Ad Performance Metrics for Mobile Gaming Success
- Boost user acquisition: A/B testing for playable ads – playablemaker.com Boost user acquisition: A/B testing for playable ads
- 10 Practical Ways to Step Up Your Mobile App Conversion Rate | Kickass Online
