Measuring the real impact of playable ads remains one of the toughest challenges for mobile game marketers. You launch campaigns, track impressions, and watch installs trickle in, but connecting those dots to understand what truly drives user acquisition feels like solving a puzzle with missing pieces. The complexity multiplies when you factor in organic lift, engagement depth, and replay behaviour. This guide walks you through proven methods to analyse playable ad metrics systematically, transforming raw data into actionable insights that optimise your campaigns and deliver measurable growth.
Table of Contents
- Understanding Essential Playable Ad Metrics
- Preparing Your Data For Effective Analysis
- Step-By-Step Guide To Analysing Playable Ad Metrics
- Common Pitfalls And Verifying Your Analysis Results
- How Playablemaker Supports Your Ad Analytics Needs
- Frequently Asked Questions
Key takeaways
| Point | Details |
|---|---|
| Identify key metrics | Track engagement rate, time spent, and replay rate to gauge ad effectiveness |
| Link paid and organic data | Analyse how ad impressions influence both direct installs and organic growth |
| Apply stepwise evaluation | Use structured analysis workflows to optimise creative and targeting decisions |
| Avoid interpretation errors | Cross-check metrics with retention data to prevent misleading conclusions |
| Leverage actionable insights | Turn metric patterns into creative improvements and audience refinements |
Understanding essential playable ad metrics
Before you can analyse performance, you need clarity on which metrics actually matter. The IAB Playables Playbook recommends tracking metrics like engagement rate, time spent interacting, and replay rate to gauge the effectiveness of interactive advertisements. Each metric reveals different aspects of user behaviour and ad impact.
Engagement rate measures the percentage of users who interact with your playable ad after viewing it. This fundamental metric tells you whether your creative successfully captures attention and motivates action. Time spent interacting goes deeper, revealing how long users engage with the playable experience. Longer interaction times typically signal genuine interest and higher quality engagement, though context matters.
Replay rate indicates users who complete your playable ad and choose to experience it again. This powerful metric suggests either exceptional creative appeal or potential confusion requiring a second attempt. Understanding the distinction matters enormously for optimisation.
The relationship between ad impressions and user actions forms another critical foundation. Impressions represent visibility, whilst actions like taps, swipes, and completions demonstrate genuine engagement. Tracking both creates the complete picture needed for measuring the effectiveness of playable ads.
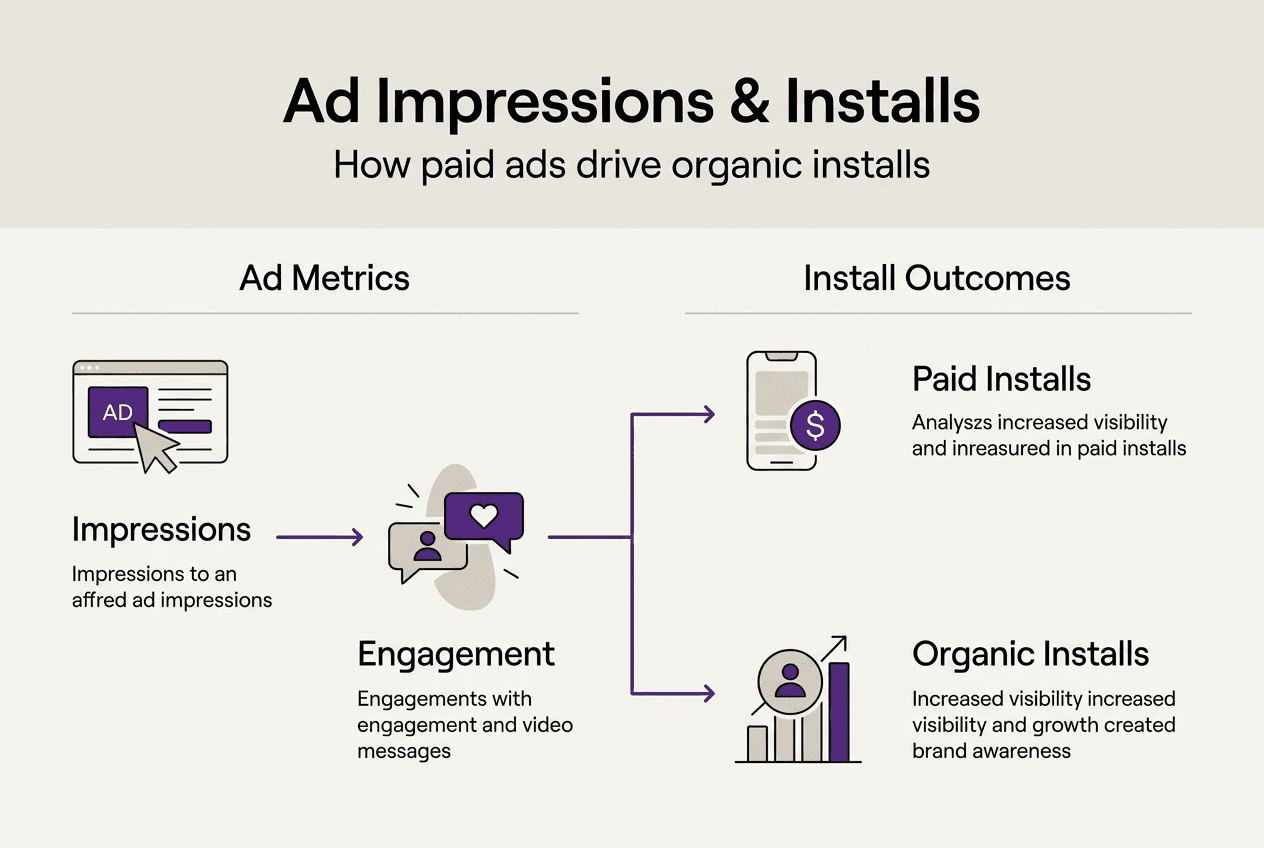
Your analysis must also account for the connection between paid impressions and organic installs. Playable ads generate direct conversions, but they simultaneously build brand awareness that drives unpaid downloads. Separating these effects requires careful methodology, yet doing so reveals your true return on ad spend. These foundational metrics enable the deeper analysis techniques covered in subsequent sections, making them essential starting points for any serious advertising performance metrics guide implementation.
Preparing your data for effective analysis
Reliable analysis demands reliable data collection from the start. Your tracking infrastructure must capture every relevant interaction point, from initial impression through installation and beyond. Most mobile game marketers rely on mobile measurement partners like Adjust, AppsFlyer, or Singular to log impressions, clicks, and installs accurately.
Ensure your tracking setup captures these essential data points:
- Impression timestamps and frequencies per user
- Engagement events within the playable experience
- Completion rates and replay actions
- Install attribution linking ad exposure to conversions
- Post-install retention and monetisation metrics
Accurate impression and interaction logging prevents the data gaps that undermine analysis later. Configure your tracking to fire events at specific playable milestones, not just at start and end points. This granular approach reveals where users disengage, providing creative optimisation opportunities.

Aligning metrics with campaign goals creates focus for your analysis efforts. If your objective centres on cost per install, prioritise engagement metrics that correlate with conversion. When retention matters most, emphasise time spent and replay behaviour as predictors of long-term value. Game ad engagement techniques vary widely, so your data preparation must reflect your specific objectives.
Pro Tip: Schedule monthly audits of your tracking implementation to catch configuration drift, SDK updates, or platform changes that silently corrupt data quality.
The connection between paid impressions and organic installs requires special preparation. Ad impressions are not just passive displays but can significantly influence user acquisition beyond direct attribution. Set up cohort tracking that monitors organic install patterns among users exposed to your ads versus control groups. This methodology isolates the broader brand impact your playable campaigns generate, revealing true effectiveness beyond last-click attribution.
Organise your data warehouse or analytics platform to enable cross-referencing between paid campaigns and organic channels. Tag campaigns consistently, maintain clean naming conventions, and document any methodology changes. Proper preparation now saves countless hours during analysis and prevents the frustration of incomplete or contradictory datasets. Understanding user engagement in ads mobile requires this foundational data hygiene.
Step-by-step guide to analysing playable ad metrics
Systematic analysis transforms raw metrics into strategic insights. Follow this proven workflow to extract maximum value from your playable ad data.
-
Calculate engagement rate by dividing total interactions by total impressions, then multiply by 100 for percentage. Benchmark this against your historical performance and industry standards. Engagement rates below 15% typically signal creative or targeting issues requiring immediate attention.
-
Measure average time spent interacting by summing all interaction durations and dividing by total engaged users. The IAB Playables Playbook highlights engagement rate, time spent, replay rate as key indicators of playable ad success. Compare time spent across different creative variations to identify which concepts hold attention most effectively.
-
Determine replay rate by calculating the percentage of users who complete your playable and immediately restart. High replay rates above 20% deserve investigation. Users either love the experience or found initial instructions unclear. Review session recordings or conduct user testing to distinguish delight from confusion.
-
Compare metrics across ad variations using controlled A/B testing. Isolate single variables like gameplay mechanics, visual style, or call-to-action placement. Statistical significance matters here, so ensure adequate sample sizes before drawing conclusions. Small percentage differences often disappear with larger audiences.
-
Relate metrics to install and retention rates by mapping engagement patterns to downstream performance. Users who spend 45+ seconds with your playable typically convert at 3x higher rates than those engaging briefly. Track day 1, day 7, and day 30 retention for cohorts segmented by playable engagement depth.
| Metric | Good Benchmark | Excellent Benchmark | Red Flag |
|---|---|---|---|
| Engagement Rate | 15-25% | 30%+ | Below 10% |
| Avg Time Spent | 30-45 seconds | 60+ seconds | Under 20 seconds |
| Replay Rate | 10-20% | 25%+ | Below 5% or above 40% |
| Install Rate | 8-12% | 15%+ | Below 5% |
Pro Tip: Use cohort analysis to track how engagement metrics predict long-term player value, not just immediate installs. Players who replay your ad often become your highest-spending users.
This structured approach reveals patterns invisible in aggregate data. You might discover that FB ad metrics mobile gaming campaigns perform differently than other channels, or that certain game genres benefit from longer playable experiences. The science of interactivity in ads demonstrates why these nuanced insights matter enormously for optimisation.
Document your analysis methodology and maintain consistent calculation methods across campaigns. This discipline enables accurate performance comparisons over time and helps you understand why playable ads convert better guide 2026 principles in your specific context.
Common pitfalls and verifying your analysis results
Even experienced analysts fall into predictable traps when interpreting playable ad metrics. Recognising these pitfalls protects you from costly optimisation mistakes.
Ignoring organic lift represents the most common error. Marketers celebrate direct install attribution whilst overlooking the brand awareness that drives unpaid downloads. Your playable ads create mental availability, making users more likely to install organically days or weeks later. Failing to measure this effect dramatically understates campaign value.
Misinterpreting replay rate causes frequent confusion. A 35% replay rate might seem impressive until user testing reveals players restarting because instructions were unclear. Context always matters. Cross-reference replay behaviour with completion rates and post-install retention to distinguish genuine engagement from user experience problems.
Other critical mistakes include:
- Comparing metrics across vastly different audience segments without accounting for demographic differences
- Overemphasising short-term install volume whilst neglecting retention quality
- Treating correlation as causation when engagement metrics align with installs
- Failing to account for seasonality, market conditions, or competitive activity
- Making creative decisions based on statistically insignificant sample sizes
“Every advertising investment generates both paid and organic user installs, highlighting the interconnected nature of ad visibility and user engagement.”
This insight from research on advertising impact underscores why holistic analysis matters. Validate your findings by cross-checking metrics with install and retention data from multiple sources. If your playable shows strong engagement but weak retention, investigate whether the ad experience misrepresents actual gameplay.
Implement these verification practices:
- Run holdout tests comparing exposed versus unexposed user cohorts
- Track organic install patterns in markets where you run playable campaigns versus markets without ads
- Monitor engagement in ads higher CTR retention relationships over extended periods
- Survey installed users about ad recall and influence on download decisions
- Compare your metrics against industry benchmarks whilst accounting for genre and audience differences
Iterative testing and refinement transform initial insights into reliable optimisation frameworks. Start with hypotheses based on your analysis, test creative variations, measure results rigorously, and refine your understanding continuously. This scientific approach separates guesswork from genuine performance improvement.
Remember that playable ad metrics exist within broader marketing ecosystems. Your analysis should inform creative strategy, audience targeting, budget allocation, and product development simultaneously. The most valuable insights often emerge from unexpected metric combinations or anomalies that challenge assumptions.
How playablemaker supports your ad analytics needs
Applying these analysis techniques becomes significantly easier with purpose-built tools designed for mobile game marketers. Playablemaker streamlines the entire workflow from creative development through performance measurement, enabling rapid testing and optimisation cycles.
Our platform integrates seamlessly with major mobile measurement partners, automatically capturing the engagement metrics discussed throughout this guide. You can track time spent, replay rates, and interaction patterns without complex SDK implementations or custom event configurations. This integration eliminates data preparation headaches, letting you focus on analysis and optimisation.
Playablemaker facilitates creative testing by enabling rapid iteration on playable concepts. Build multiple variations quickly using our no-code tools, deploy them across campaigns, and compare performance metrics in unified dashboards. The faster you test, the quicker you discover what resonates with your target audience.
Mobile game marketers choose Playablemaker because we understand the unique challenges of interactive ad analytics. Our platform reflects the methodologies outlined in this guide, making sophisticated analysis accessible without requiring data science expertise. Explore how why playable ads are effective principles translate into measurable results through our analytics features.
Discover comprehensive resources about playable ads explained concepts and learn how the playablemaker platform transforms campaign performance through better creative and deeper insights.
Frequently asked questions
How do engagement rate and replay rate differ in indicating ad performance?
Engagement rate measures the percentage of users who interact with your playable ad after viewing it, indicating initial appeal and creative effectiveness. Replay rate tracks users who complete the experience and choose to play again, signalling either exceptional engagement or potential confusion requiring a second attempt. Together, these metrics provide fuller insight into both surface-level attraction and deeper user interest, helping you distinguish between ads that capture attention versus those that genuinely resonate.
Can ad impressions cause organic installs and how is this tracked?
Every advertising investment generates both paid and organic user installs, highlighting the interconnected nature of ad visibility and user engagement. Impressions boost organic installs through brand exposure and mental availability, even when users don’t immediately click or convert. Track this effect by comparing organic install patterns in markets with active campaigns versus control markets, and by monitoring organic growth rates among user cohorts exposed to your ads. Proper attribution requires integrating paid and organic data sources to reveal the complete impact of your advertising investment.
What are the best practices for validating playable ad metric analysis?
Cross-check your metrics with install and retention data from multiple sources to ensure consistency and accuracy. Avoid overemphasising single indicators without considering broader context, campaign objectives, and user lifecycle patterns. Use cohort analyses that track exposed versus unexposed users over extended periods, and implement holdout tests that isolate advertising effects from organic growth. Statistical significance matters enormously, so ensure adequate sample sizes before making optimisation decisions based on your findings.
What engagement time threshold indicates high-quality playable ad interactions?
Playable ad interactions exceeding 45 seconds typically correlate with significantly higher install rates and better post-install retention compared to brief engagements. However, optimal interaction time varies by game genre, target audience, and creative complexity. Puzzle games often sustain longer engagement than action titles, whilst hardcore gamers tolerate more complex playables than casual audiences. Analyse your specific data to identify the engagement duration sweet spot that predicts quality installs for your campaigns, then optimise creative length and complexity accordingly.
How frequently should playable ad metrics be reviewed for campaign optimisation?
Review core metrics like engagement rate, time spent, and install rate daily during campaign launch phases to catch performance issues quickly. Once campaigns stabilise, shift to weekly deep-dive analysis that examines trends, cohort behaviour, and retention patterns. Monthly reviews should focus on strategic insights, creative refresh needs, and alignment with broader user acquisition goals. Continuous monitoring prevents wasted spend on underperforming creatives whilst enabling rapid scaling of winning variations.
Recommended
- Google Ads Performance Metrics: Optimise UA Costs – playablemaker.com Google Ads Performance Metrics: Optimise UA Costs
- Master Mobile Ad Trend Analysis 2025 for Playable Ads Success – playablemaker.com Master Mobile Ad Trend Analysis 2025 for Playable Ads Success
- Google Ad Performance: Maximising Mobile Game ROI – playablemaker.com Google Ad Performance: Maximising Mobile Game ROI
- Step-by-Step Guide to A/B Testing Ads for Mobile Games – playablemaker.com Step-by-Step Guide to A/B Testing Ads for Mobile Games
- Google Ads tracking methods that boost local business success
