Playable ad budgets can make or break your user acquisition performance in mobile gaming. Without strategic budget allocation, you risk overspending on creatives that underperform or missing opportunities to scale winning campaigns efficiently. Marketing specialists need precise budgeting frameworks to reduce cost per install whilst maximising engagement through interactive ad experiences. This guide delivers actionable strategies to budget playable ad creatives properly, covering preparation, scaling techniques, and performance optimisation to achieve maximum return on investment in 2026.
Table of Contents
- Understanding The Impact Of Playable Ad Creatives On User Acquisition Budgets
- Preparing Your Budget: What You Need To Create Cost-Effective Ad Creatives
- Step-By-Step Budgeting And Scaling Strategies For Playable Ad Creatives
- Monitoring Performance And Optimising Your Ad Creative Budget
- Boost Your Playable Ads With Playablemaker In 2026
Key takeaways
| Point | Details |
|---|---|
| Cost reduction | Effective budgeting of playable ad creatives can reduce cost per install by up to 40% compared to standard formats. |
| Gradual scaling | Increase ad budgets by 20–30% increments to maintain stable CPI whilst expanding reach. |
| Creative rotation | Rotate creatives one or two at a time to avoid resetting platform learning phases. |
| Format diversity | Leverage diverse creatives including videos and playables to optimise campaigns across multiple platforms. |
| Adaptive testing | Testing and adaptive experimentation improve budget allocation efficiency through data-driven insights. |
Understanding the impact of playable ad creatives on user acquisition budgets
Playable ads have become essential tools for mobile game user acquisition because they deliver measurable cost savings whilst engaging users through interactive experiences. Playable ads on Mintegral often cut CPI by 20–40% for games with simple mechanics, making them particularly valuable for puzzle, idle, simulation, and merge genres. This cost efficiency stems from their ability to pre-qualify users by letting them experience gameplay before installation, filtering out casual browsers and attracting genuinely interested players.
The performance trajectory of playable ads has reached unprecedented levels. Playable ads have achieved record-high performance scores of 191 in 2025, demonstrating their growing effectiveness in competitive markets. This advancement means budget allocation towards playables now delivers stronger returns than traditional static or video formats alone. Marketing specialists who understand why playable ads convert better can prioritise spending on formats that generate higher lifetime value users.
Interactive ad experiences also strengthen retention metrics beyond initial acquisition. Users who engage with playable ads before installing typically demonstrate 30% higher day-seven retention compared to those acquired through standard video ads. This retention advantage compounds over time, reducing the effective cost per retained user and improving overall campaign profitability. Allocating budget to playables therefore supports both immediate acquisition efficiency and long-term player value.
Different game mechanics benefit variably from playable ad investment. Puzzle games see the strongest CPI reductions because their core loops translate naturally into brief interactive demos. Idle and simulation games require more creative budget to communicate progression systems effectively within 30-second experiences. Understanding these mechanics-specific requirements helps you distribute creative budgets proportionally across your game portfolio.
Competitive markets demand efficient user acquisition strategies. With mobile games user acquisition becoming increasingly sophisticated, playable ads offer differentiation through engagement quality rather than bid volume alone. Smart budget allocation towards interactive creatives positions your campaigns to win users through experience rather than outspending competitors on standard formats.
Key considerations for playable ad budget impact:
- Playables reduce wasted spend by pre-qualifying users through gameplay interaction
- Higher engagement rates translate to better platform algorithm performance
- Initial creative production costs are offset by lower ongoing CPI
- Performance data from playables informs broader creative strategy
Preparing your budget: what you need to create cost-effective ad creatives
Effective playable ad budgeting starts with understanding platform-specific creative requirements and associated production costs. Google UAC campaigns require a minimum of 5 landscape, 5 portrait, 5 square videos, 5 images, and 5 short text lines to enter the learning phase efficiently. Meeting these minimums ensures your campaign receives adequate data flow for optimisation, making this initial creative investment non-negotiable for serious user acquisition efforts.
Production costs vary significantly based on creative complexity and development approach. Traditional agency-produced playable ads typically cost £8,000 to £25,000 per creative, whilst no-code platforms reduce this to £500 to £3,000 per playable. Video ads range from £1,500 for simple recordings to £8,000 for professionally animated content. Your budget preparation must account for these format-specific costs multiplied by the quantity needed across campaign variants and testing iterations.

Regional market considerations dramatically affect budget allocation efficiency. North America leads global ad spend at 61%, with Asia and Europe growing rapidly, meaning CPI benchmarks and competitive intensity vary by geography. Allocating £15,000 monthly budget in North America might acquire 3,000 installs, whilst the same spend in Southeast Asia could deliver 8,000 installs. Understanding these regional dynamics helps you distribute creative budgets to markets offering optimal return.
Setting clear campaign objectives before creative production prevents budget waste on misaligned assets. Acquisition-focused campaigns need playables emphasising immediate gameplay satisfaction, whilst retention-focused efforts require creatives showcasing progression depth. Defining these goals upfront ensures your creative budget produces assets that serve specific performance targets rather than generic experiences.
Pro tip: Allocate 20% of your initial creative budget specifically for rapid iteration testing. This reserve fund lets you quickly produce variant creatives when early campaign data reveals unexpected opportunities or performance gaps, maintaining momentum without waiting for quarterly budget reviews.
Budget planning should incorporate both fixed creative production costs and variable media spend. A typical monthly allocation might dedicate 30% to new creative development, 60% to media buying, and 10% to testing and optimisation tools. This distribution ensures continuous creative freshness whilst maintaining sufficient media weight for meaningful performance data.
| Budget component | Percentage allocation | Purpose |
|---|---|---|
| New creative production | 25-35% | Develop fresh playables and videos |
| Media spend | 55-65% | Platform advertising costs |
| Testing and tools | 10-15% | Analytics and experimentation platforms |
Exploring creative ad concepts for mobile games before finalising budgets helps identify which concepts warrant higher production investment. Some mechanics translate into compelling 15-second playables with minimal development, whilst others need fuller 60-second experiences requiring larger creative budgets.
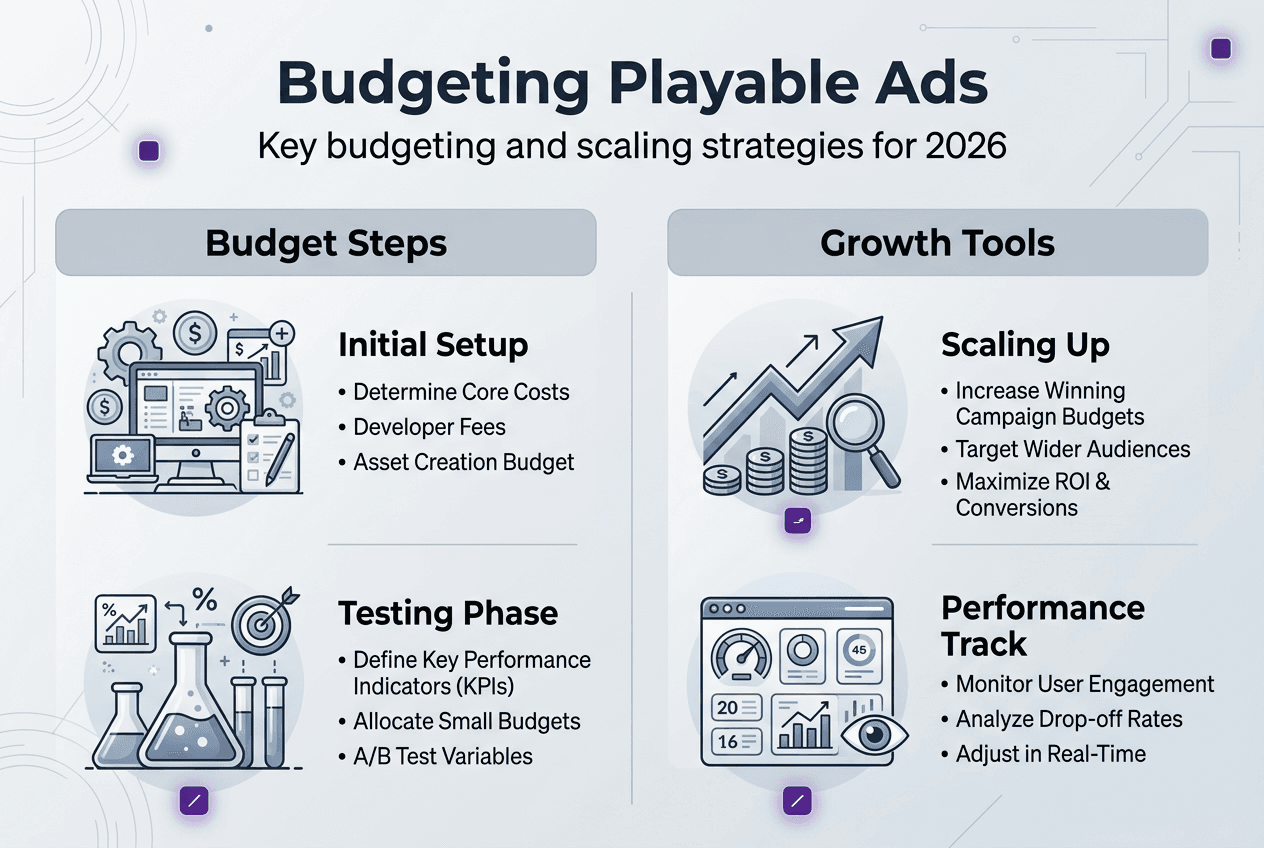
Step-by-step budgeting and scaling strategies for playable ad creatives
Successful playable ad budgeting follows a structured approach that balances initial investment with incremental scaling based on performance data. Start by allocating your baseline budget across required creative formats, ensuring you meet platform minimums whilst reserving funds for performance-driven expansion. For a £20,000 monthly budget, consider distributing £6,000 to initial playable production, £2,000 to supporting video assets, and £12,000 to media spend with testing allocation.
Scaling budgets demands disciplined incremental increases to maintain cost efficiency. Increasing budgets on Google Ads by 20–30% at a time helps avoid rapid CPI spikes that occur when sudden budget jumps force platforms to expand audience targeting beyond optimal parameters. If your campaign performs well at £500 daily spend with £2.50 CPI, increase to £625 daily rather than jumping to £1,000, monitoring CPI stability before further expansion.
Creative rotation strategy directly impacts budget efficiency through platform learning dynamics. Replacing all creatives simultaneously resets algorithm optimisation, temporarily increasing CPI by 40% to 60% whilst platforms relearn audience patterns. Instead, rotate one or two creatives weekly, maintaining performance stability whilst introducing fresh content. This approach preserves your budget investment in algorithm training whilst combating creative fatigue.
Step-by-step scaling process:
- Launch campaigns with minimum required creative sets and £50-£100 daily spend
- Monitor performance for 7 days to establish baseline CPI and conversion metrics
- Increase daily budget by 20% if CPI remains within 10% of target
- Introduce one new creative variant every 5-7 days based on performance insights
- Scale winning ad groups to 150% of initial budget over 14-day periods
- Pause underperforming creatives after 10 days if CPI exceeds target by 25%
A/B testing frameworks optimise budget allocation by identifying top performers before major scaling. Run parallel creative variants at equal budget levels for statistically significant periods, typically 1,000 impressions minimum per variant. Shift budget towards winners gradually rather than immediately, as early performance differences sometimes normalise over larger sample sizes. Understanding the playable ads design process helps you develop testable hypotheses for these experiments.
Pro tip: Create a scaling matrix that defines exact budget increase triggers based on performance thresholds. For example, if CPI drops 15% below target and conversion rate exceeds 8%, automatically approve 30% budget increases. This removes emotional decision-making and ensures consistent scaling discipline.
Comparative budget strategies reveal optimal scaling approaches for different campaign maturity stages. New campaigns benefit from conservative 15-20% weekly increases, whilst established campaigns with stable performance can handle 25-35% expansions. Testing these approaches across campaign groups helps identify your optimal scaling velocity.
| Campaign stage | Budget increase rate | Monitoring frequency | Risk level |
|---|---|---|---|
| Launch (days 1-14) | 15-20% weekly | Daily | High |
| Growth (days 15-45) | 25-30% weekly | Every 2-3 days | Medium |
| Mature (45+ days) | 30-40% weekly | Weekly | Low |
Exploring budget scaling on Google Ads best practices provides platform-specific insights for maintaining efficiency during expansion phases.
Monitoring performance and optimising your ad creative budget
Effective budget optimisation requires systematic tracking of metrics that reveal creative performance and spending efficiency. Monitor cost per install, click-through rate, day-one retention, and conversion rate as primary indicators of budget health. CPI alone masks important quality signals, a £2.00 CPI delivering 45% day-seven retention outperforms a £1.50 CPI with 25% retention despite appearing less efficient initially.
Data-driven creative rotation maintains campaign freshness whilst preserving algorithm learning. Analyse creative performance weekly, identifying assets showing declining CTR or rising CPI trends. Replace bottom performers systematically rather than waiting for complete creative fatigue, as gradual rotation prevents the performance valleys associated with bulk creative refreshes. Track each creative’s performance trajectory over its lifecycle to understand natural decay patterns.
Adaptive testing methodologies dramatically improve budget allocation compared to traditional A/B approaches. Adaptive experimentation can boost click-through rates by 46% and clicks by 27% compared to traditional A/B tests by dynamically shifting traffic towards better performers during the test period. This approach reduces wasted spend on underperforming variants whilst accelerating learning about optimal creative directions.
Critical performance metrics for budget optimisation:
- Cost per install trends across creative variants and time periods
- Click-through rate decay patterns indicating creative fatigue timing
- Retention cohorts by creative source to assess quality
- Return on ad spend calculated at 30, 60, and 90-day windows
- Creative production cost amortised across installs delivered
Performance comparison tables help visualise budget efficiency across creative types and platforms. Structure these comparisons to highlight cost per quality install rather than raw CPI, incorporating retention and lifetime value projections.
| Creative type | Average CPI | Day 7 retention | Estimated 90-day LTV | Cost per retained user |
|---|---|---|---|---|
| Playable ads | £2.20 | 42% | £8.50 | £5.24 |
| Video ads | £1.85 | 31% | £6.20 | £5.97 |
| Static images | £1.45 | 22% | £4.80 | £6.59 |
Dynamic budget reallocation based on performance data prevents continued investment in declining assets. Establish clear performance thresholds that trigger automatic budget shifts, such as reducing spend by 50% when CPI exceeds target by 20% for three consecutive days. These rules-based adjustments maintain efficiency without requiring constant manual intervention. Implementing dynamic ad creative optimisation processes helps automate these performance-based budget decisions.
Regular budget audits identify spending leaks and optimisation opportunities. Review your complete creative portfolio monthly, calculating the true cost per retained user for each asset including production expenses. Creatives with high initial CPI but strong retention often justify continued investment, whilst low-CPI creatives delivering poor retention waste budget despite appearing efficient.
Boost your playable ads with PlayableMaker in 2026
Creating budget-friendly playable ads no longer requires extensive development resources or agency partnerships. PlayableMaker provides no-code tools that let marketing specialists build engaging interactive ads quickly and affordably, dramatically reducing the production costs that traditionally consume creative budgets. Our platform supports data-driven creative iteration, enabling you to test multiple playable variants within your existing budget constraints rather than committing large sums to single creative bets.
Understanding playable ads explained helps you leverage our platform’s full capabilities for user acquisition. Discover practical strategies for scaling playable ads budget-friendly whilst maintaining quality and performance. Explore the psychology behind playable ads to create experiences that maximise engagement within your creative budget parameters.
FAQ
How many creatives should I budget for Google UAC campaigns?
Google UAC requires at least 5 landscape, 5 portrait, 5 square videos, 5 images, and 5 short text lines to optimise effectively. Budget for producing these minimum assets plus 3-5 additional variants for testing, totalling approximately 20-25 creative assets for a robust initial campaign. This investment ensures your campaign enters the learning phase with sufficient creative diversity.
What is the best way to scale budgets without increasing CPI rapidly?
Increasing budgets by 20–30% increments avoids rapid CPI spikes that occur when platforms expand targeting too quickly. Monitor CPI stability for 3-5 days after each increase before implementing the next scaling step. This gradual approach maintains algorithm efficiency whilst expanding reach, preventing the cost inflation associated with aggressive budget jumps.
How often should creatives be rotated in campaigns?
Rotate creatives one or two at a time to avoid resetting the UAC learning phase, maintaining traffic quality and cost efficiency. Implement weekly creative rotations rather than monthly bulk refreshes, replacing bottom performers systematically. This steady rotation combats creative fatigue whilst preserving your investment in platform algorithm optimisation.
Why are playable ads essential for mobile game user acquisition in 2026?
Playable ads reduce CPI by up to 40% and have record-high performance scores, making them critical for competitive user acquisition. Their interactive nature pre-qualifies users through gameplay experience, delivering higher retention rates and better lifetime value compared to passive ad formats. This combination of lower acquisition costs and higher user quality makes playables essential for efficient growth in 2026’s competitive landscape.
Recommended
- Playable Ad Trends 2025: Build Engaging Ads Without Coding – playablemaker.com Playable Ad Trends 2025: Build Engaging Ads Without Coding
- 7 Essential Mobile Game Ad Trends to Know for 2025 – playablemaker.com 7 Essential Mobile Game Ad Trends to Know for 2025
- Ad tech trends 2026: create playable ads fast and affordably – playablemaker.com Ad tech trends 2026: create playable ads fast and affordably
- Master Mobile Ad Trend Analysis 2025 for Playable Ads Success – playablemaker.com Master Mobile Ad Trend Analysis 2025 for Playable Ads Success
- How to analyze ad trends for better ROI in 2026 – Palmador Blog
