
TL;DR:
- Most mobile gaming ad spend targets the wrong metrics, neglecting downstream user value signals. Data should connect ad creative to user retention and monetization outcomes rather than just installs, enabling more efficient campaigns. As privacy regulations evolve, adopting a layered, value-based measurement approach with automation and creative testing is essential for sustained success.
Most mobile gaming ad spend is still pointed at the wrong target. Teams pour budget into campaigns, celebrate strong install numbers, and then wonder why revenue fails to follow. The data to fix this is already in your hands. The problem is knowing which signals to act on and how to connect ad creative directly to the users who stay, spend, and return. Data’s core role in mobile gaming user acquisition is to link ad exposure and creative choice to downstream value outcomes, not just installs. This guide explains exactly how to make that connection work.
Table of Contents
- What does data really power in mobile ads?
- Beyond installs: The shift to value-based optimisation
- Privacy, attribution, and the new data stack for 2026
- Scaling creativity and reporting: The 2026 data-driven workflow
- What most UA managers still miss about data’s real impact
- Next steps: Power your ads with smarter data and creative
- Frequently asked questions
Key Takeaways
| Point | Details |
|---|---|
| Downstream over installs | Optimise user acquisition around retention and monetisation—not just for a low cost per install. |
| Use cohort and event data | Track post-install behaviour by cohort to prove true UA campaign value and iterate effectively. |
| Balance privacy and measurement | Adopt privacy-safe, modelled tracking alongside deterministic signals to maintain optimisation accuracy. |
| Creatives at scale need data | Handle thousands of ad variants and rapid reporting by leveraging workflow automation and actionable data insights. |
| Choose metrics wisely | Rely on both aggregate and user-level measurement frameworks—align metrics to real business impact, not just tool output. |
What does data really power in mobile ads?
With the stage set for why data matters, let’s get specific about what data empowers at every stage of a campaign. Most practitioners understand that data informs bidding and targeting. Fewer appreciate just how far that influence extends, from the moment a user sees a creative variant all the way through to their monetisation behaviour weeks later.
UA in mobile gaming operates as a closed loop. Creative assets are served to audiences, signals from those impressions feed back into bidding algorithms, and post-install events inform which creative and audience combinations are producing genuine business value. When any part of that loop breaks, spend efficiency drops even if install volume stays high.
“The core function of data in mobile gaming UA is to connect ad exposure and creative choice to downstream value outcomes, including engagement, retention, and monetisation, rather than treating installs as the final signal.”
The practical implication is that acquisition and retention strategies must be designed together, not in separate silos. A creative that generates cheap installs but attracts users with a two-day retention rate is a liability, not an asset.
Core metrics to track across the funnel:
- Impression to install rate (ITI): Measures creative resonance at the top of the funnel
- Day 1, Day 7, and Day 30 retention: Shows whether acquired users find genuine value in the game
- Session length and frequency: Tracks depth of engagement post-install
- In-app purchase rate (IAP rate): Indicates monetisation potential by cohort
- Return on ad spend by cohort (cohort ROAS): The single most actionable measure of campaign efficiency
- Cost per loyal user (CPLU): Combines install cost with retention probability to give a true acquisition cost
| Metric | What it measures | Optimisation signal |
|---|---|---|
| CPI (cost per install) | Volume efficiency | Useful but insufficient alone |
| Day 7 retention | Early loyalty | Reveals creative and audience quality |
| ROAS at Day 30 | Revenue return | Defines true campaign profitability |
| LTV (lifetime value) | Long-term business value | The ultimate efficiency target |
| Cohort ROAS | Value by acquisition group | Enables creative and channel comparison |
The ROAS optimisation methodology that leading UA teams follow treats the entire funnel as a single optimisation problem. KPIs and experiments are set around post-install value, not CTR or CPI alone. Teams that adopt this approach typically find that their most cost-efficient creatives and their highest-value creatives are different assets entirely.
Beyond installs: The shift to value-based optimisation
Now that the full scope of data’s purpose is clear, it is important to see how leaders are moving beyond surface metrics like installs and CPIs. This shift is not simply philosophical. It is driven by the practical reality that cheap installs have become cheaper than ever, while valuable users are harder to find and retain.
Rewarded user acquisition is one of the clearest examples of this transition. Rewarded UA emphasises data-backed measurement of engagement and retention, with cohort-level tracking described as necessary to prove performance beyond installs. Without event tracking essentials built into the measurement stack, rewarded campaigns cannot demonstrate their true value to finance or leadership.
The iOS privacy changes introduced through Apple’s App Tracking Transparency (ATT) framework accelerated this shift. Traditional deterministic attribution, which matched users one-to-one across apps using device identifiers, became largely unavailable without explicit consent. Teams were forced to innovate.
The modern iOS measurement approach combines several techniques. SKAdNetwork (SKAN) provides deterministic postbacks at an aggregate level without exposing individual user data. In-funnel event capture collects behavioural signals within the app itself. Privacy-preserving aggregation and modelling then fill the gaps where user-level data is absent. This mobile measurement framework now represents standard practice for any team operating seriously on iOS.
Setting up a value-based measurement framework in four steps:
- Define your LTV proxy events. Choose two or three in-app events that correlate strongly with long-term revenue. Common choices include reaching a specific game level, completing a tutorial, or making a first purchase within 72 hours.
- Map those events to your attribution window. Ensure your mobile measurement partner (MMP) and ad networks are capturing these events within a consistent attribution window, typically seven or fourteen days post-install.
- Segment by acquisition cohort. Group users by the channel, creative, and audience that brought them in. This makes it possible to compare value across campaigns on equal terms.
- Report on cohort ROAS at fixed intervals. Day 7 and Day 30 cohort ROAS are the most practical checkpoints for optimisation decisions.
Understanding user engagement metrics at each of these stages provides the signal needed to adjust creative strategy, bidding, and audience targeting with confidence. Teams that skip this structure often find themselves optimising for the wrong outcome.
Pro Tip: Integrate cohort analysis tools during your initial UA stack setup rather than retrofitting them later. Cohort visibility at launch means you begin learning from your first campaigns rather than spending two or three months in the dark.

Privacy, attribution, and the new data stack for 2026
As value-based measurement takes over, new privacy and technology shifts demand a fresh approach to tracking. Let’s break down what actually works now.
Apple’s ATT framework fundamentally disrupted the attribution models that the mobile gaming industry had relied on for a decade. Before ATT, mobile measurement partners could match ad exposures to installs and post-install events at the individual user level using the Identifier for Advertisers (IDFA). After ATT, consent rates settled well below 50% in most gaming categories, leaving large portions of traffic unattributable through traditional methods.
Modern optimisation in mobile marketing now increasingly relies on privacy-safe and modelled measurement to recover conversion signal gaps caused by iOS and ATT consent limitations. This is not a workaround; it is the intended direction of the ecosystem.
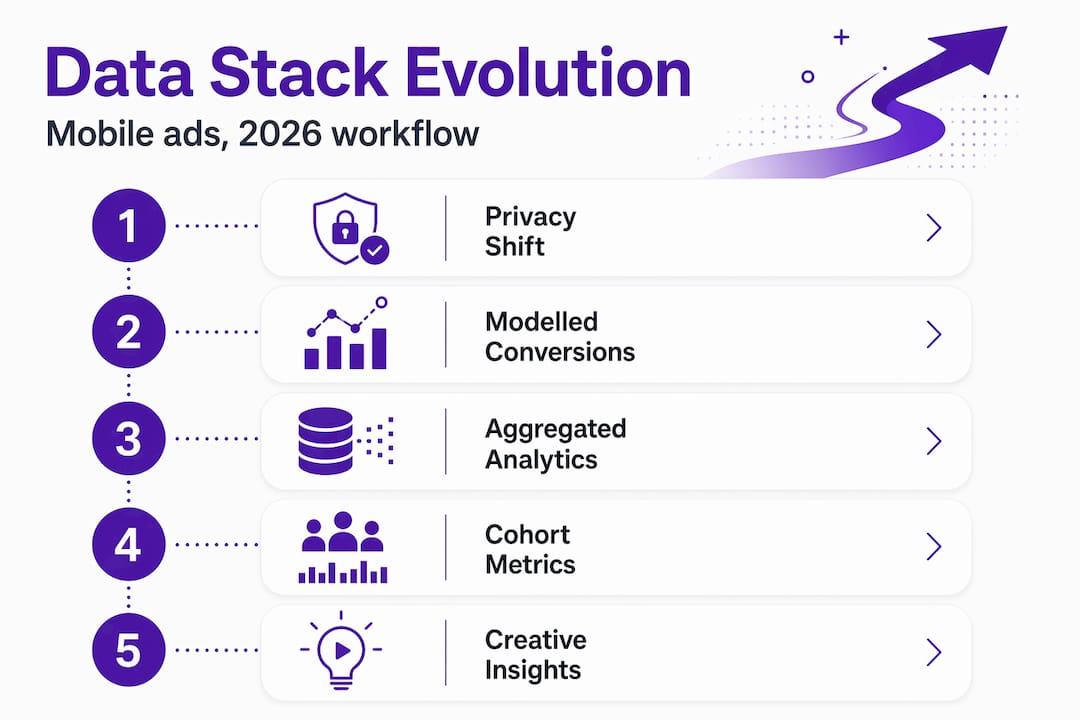
The modern measurement toolkit for 2026 includes:
- SKAdNetwork (SKAN 4.0): Apple’s privacy-preserving attribution framework, now supporting more granular conversion values and some limited crowd anonymity thresholds
- Mobile measurement partners (MMPs): Centralised platforms that aggregate signals from multiple channels and apply modelling where deterministic data is absent
- Modelled conversions: Statistical estimates of conversions that were not directly observed, used by platforms to maintain bidding signal density
- Marketing mix modelling (MMM): Aggregate, econometric modelling that estimates channel-level contribution to revenue without requiring user-level data
- Consent Mode: A framework from Google that adjusts measurement behaviour based on user consent status while using modelling to fill gaps
The measurement design philosophy for 2026 recommends building measurement stacks that prefer privacy-preserving aggregation and modelling layers rather than relying on deterministic user-level tracking everywhere. The goal is to ensure downstream optimisation can still function when data is incomplete, which it often will be.
A practical risk to watch for is measurement bias. When you lose observability for unconsented users or specific device cohorts, automated bidding systems can develop biased learning. They effectively learn from an unrepresentative sample of users, which skews optimisation towards cheaper or more consent-prone audiences rather than genuinely higher-value ones. Consent Mode style approaches and on-device measurement help restore more representative signal.
Pro Tip: Review your ad targeting guides regularly against your actual consent rates by market. A campaign that looks efficient in aggregate may be systematically excluding your highest-value user segments in markets with low ATT opt-in rates.
Your playable analytics layer provides a direct window into engaged user behaviour before the install event even occurs, making it a valuable complement to post-install measurement frameworks.
Scaling creativity and reporting: The 2026 data-driven workflow
With so many new measurement tools in play, scalability and speed are essential. Let’s see how the most effective teams handle creative and reporting at high velocity.
The economics of creative testing have changed dramatically. In 2026, gaming UA spend hit 25 billion dollars globally, with AI tools enabling advertisers to produce and test thousands of creative variations per quarter. Leading teams now run between 2,400 and 2,600 creative tests quarterly, representing a 25 to 30 per cent increase year on year. Manual reporting workflows simply cannot keep pace with that volume.
The practical answer is a hybrid model. Automation handles data collection, anomaly detection, and routine performance reporting. Human analysts focus on strategic interpretation, creative direction, and decisions that require understanding of business context.
| Workflow element | Manual approach | Automated approach |
|---|---|---|
| Data collection | Spreadsheet exports, manual pulls | MMP dashboards, API integrations |
| Performance reporting | Weekly analyst reports | Daily automated alerts and dashboards |
| Creative performance ranking | Manual review | AI-assisted scoring and clustering |
| Budget reallocation | Weekly optimisation calls | Rules-based or algorithmic adjustment |
| Anomaly detection | Human review of reports | Real-time flagging via monitoring tools |
Essential workflow elements for 2026 UA teams:
- A centralised creative library with structured naming conventions tied to performance data
- Automated creative tagging that connects asset attributes (character type, gameplay shown, reward visible) to performance outcomes
- A weekly creative review cadence where human strategists assess AI-ranked performance data and set new hypotheses
- Clear escalation criteria defining when automated budget rules require human override
- A structured creative retirement process that removes underperforming assets before they waste significant spend
Optimising creatives at this scale requires systematic thinking, not just creative instinct. The teams that pull ahead are those who treat creative testing as a scientific process, with clear hypotheses, controlled variables, and measurable success criteria. UA funnel strategies must be designed to accommodate rapid creative iteration rather than treating creative as a static element.
The role of human oversight remains critical even as automation expands. AI tools are excellent at identifying what performed well in the past. They are not equipped to identify when market conditions have shifted, when a new creative concept is genuinely novel, or when a metric anomaly reflects a tracking error rather than a genuine trend.
What most UA managers still miss about data’s real impact
Before wrapping up, it is worth reflecting on how the smartest teams extract outsized value from their data, not by following every trend, but by designing for true business impact.
The most common mistake is not a lack of data. It is a lack of clarity about what question each dataset is actually answering. Teams invest heavily in new measurement tools, add more attribution layers, and then find themselves with more dashboards but no clearer optimisation decisions. More signal is only useful if you know what business question it addresses.
“Marketing mix modelling and multi-touch attribution are not competing methods for the same answer. They address fundamentally different questions. MMM estimates aggregate causal contribution at the channel level, while MTA assigns credit across individual user journeys. Treating one as the ground truth for decisions that require the other leads to systematically flawed conclusions.”
The MMM versus MTA distinction is not a technical detail. It has direct implications for budget allocation decisions. A team using MTA alone to set channel budgets will consistently undervalue channels that influence early in the journey but rarely receive last-touch credit. A team relying solely on MMM will lack the granularity to optimise individual campaign or creative decisions.
The practical answer is to use both, but assign each to the decisions it is actually suited for. Use MMM for quarterly budget allocation across channels and platforms. Use MTA or cohort ROAS for weekly creative and campaign optimisation. Align your team around a single source of truth for each decision type rather than allowing parallel measurement frameworks to generate conflicting recommendations.
Playable analytics insights sit in a particularly useful position within this framework. They capture pre-install behavioural intent, which neither MTA nor MMM typically addresses, giving you an additional signal about user quality before the install event occurs.
Pro Tip: Build your data stack around your LTV goals, not around what your tools provide by default. Most MMPs and ad networks will optimise for whatever event you designate as your conversion. If you designate install, they will find cheap installs. If you designate a Day 7 retention event or a first purchase, you will attract fundamentally different users.
Next steps: Power your ads with smarter data and creative
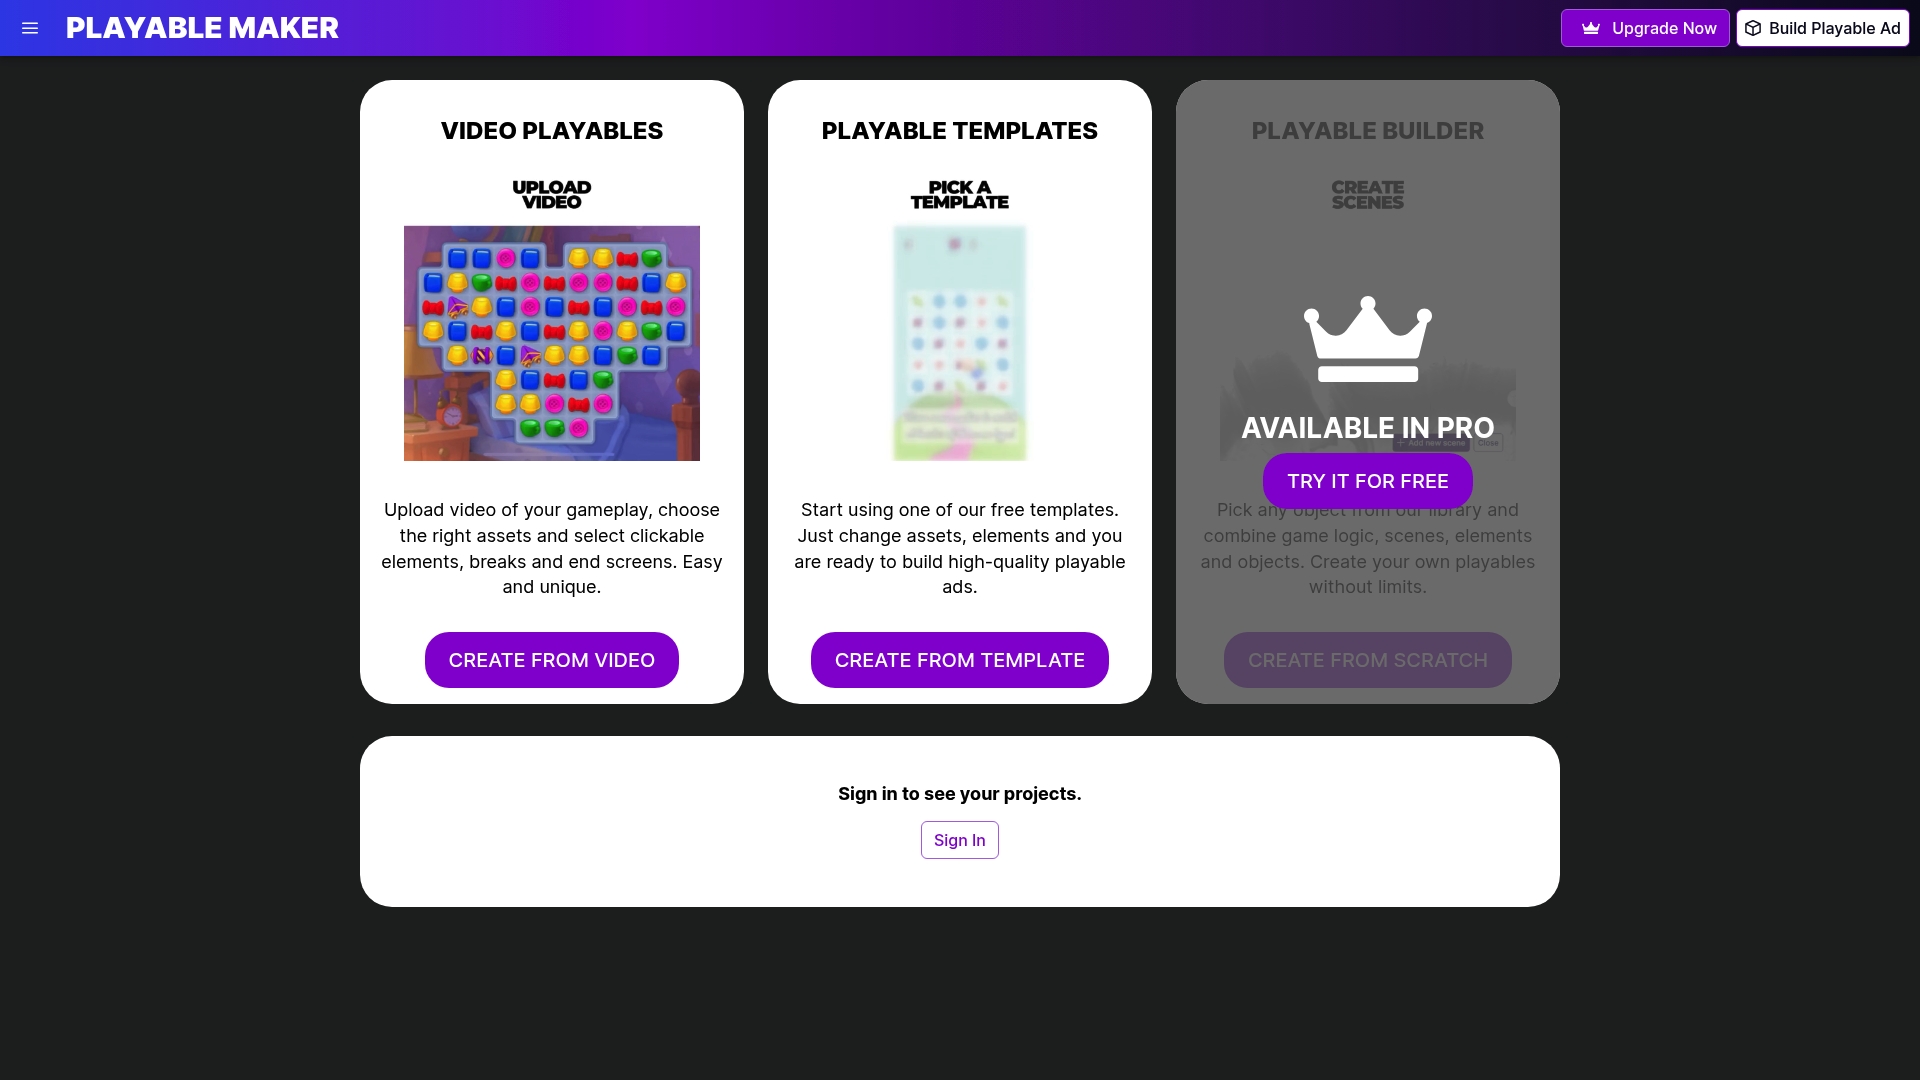
Understanding the data framework is only the beginning. The next step is putting it into practice with creative assets that generate meaningful behavioural signals before users even reach your app. Playable ads succeed precisely because they produce richer pre-install intent data than static or video formats, allowing your measurement stack to start learning about user quality from the first interaction.
Playable ads have moved from a novelty format to a core part of performance-driven UA strategies. At PlayableMaker, we built a no-code platform specifically so that UA managers can iterate on interactive ad creative at the same speed their data demands, without waiting on development queues or stretching budgets. If you are ready to align your creative velocity with your measurement sophistication, building interactive ads no longer requires a development team or a six-figure production budget.
Frequently asked questions
How does data improve ad creative performance in mobile UA?
Data links creative choices to downstream user value, helping you iterate on what actually drives retention and monetisation rather than optimising for surface-level engagement signals alone.
What are modelled conversions and why are they important for UA in 2026?
Modelled conversions fill missing data gaps caused by privacy restrictions, letting optimisation algorithms and reporting dashboards function effectively even when direct attribution signals are incomplete.
How many creative variations do top gaming advertisers test per quarter?
In 2026, leading advertisers test between 2,400 and 2,600 creative variants quarterly, representing a 25 to 30 per cent increase year on year driven largely by AI-assisted production tools.
What KPIs matter most beyond installs for user acquisition?
Cohort-level retention, engagement depth, and ROAS at Day 7 and Day 30 are the most actionable post-install KPIs for any UA campaign aiming to attract genuinely valuable users.
Should I trust one attribution method for all my optimisation decisions?
No. MMM and MTA answer different questions, so using only one will lead to systematic gaps in your optimisation logic. Assign each method to the specific decision type it is suited for.
Recommended
- Understanding What is User Acquisition in Mobile Gaming – playablemaker.com Understanding What is User Acquisition in Mobile Gaming
- 8 Key Ad Performance Metrics for Mobile Gaming Success – playablemaker.com 8 Key Ad Performance Metrics for Mobile Gaming Success
- Understanding User Acquisition Strategy for Apps – playablemaker.com Understanding User Acquisition Strategy for Apps
- Customer Acquisition and Retention – Winning Mobile Game Players – playablemaker.com Customer Acquisition and Retention – Winning Mobile Game Players
