
TL;DR:
- Ad creative dashboards provide unified, asset-level performance insights across multiple platforms.
- They enable proactive fatigue detection and rapid creative iteration to maintain campaign efficiency.
- Human creativity and strategic questioning remain essential despite advanced analytic tools.
Most user acquisition managers already know that ad spend in mobile gaming is deeply unequal. Top 2% of creatives drive 53% of total gaming ad spend. If you are not tracking which assets sit in that top tier, you are almost certainly funding the other 98%. An ad creative dashboard exists precisely to solve this problem, centralising performance data across every platform and every format so that your team can see, compare, and act on creative intelligence quickly. In an environment where ad fatigue arrives within days and campaign budgets are finite, that centralised clarity is not optional.
Table of Contents
- What is an ad creative dashboard?
- Key mechanics and features mobile marketers need
- How dashboards power creative testing and optimisation
- Handling challenges: edge cases and common pitfalls
- What most marketers miss about creative dashboards
- Explore tools for better playable ad performance
- Frequently asked questions
Key Takeaways
| Point | Details |
|---|---|
| Unified data clarity | Ad creative dashboards centralise campaign analytics for clearer insights and optimisation. |
| Essential mobile metrics | Metrics like CPI, ROAS, and IPM drive high-impact user acquisition decisions in gaming. |
| Outpacing ad fatigue | Weekly creative refreshes identified by dashboards minimise wasted spend and boost results. |
| Value beyond volume | Winning campaigns pair dashboards with diversified, strategically tested creative ideas. |
What is an ad creative dashboard?
An ad creative dashboard is a specialised analytics environment that aggregates performance data from every advertising network your team uses, presenting it at the individual asset level rather than at the campaign level. Think Meta, Google, TikTok, and ironSource all feeding into a single view, broken down not just by campaign but by creative, hook, character, format, and even specific gameplay moment.
This is fundamentally different from a standard marketing dashboard. A standard dashboard tells you whether a campaign is profitable. A creative dashboard tells you why, pointing at the exact image, video sequence, or playable mechanic that is generating results or killing them.
A well-built creative analytics platform aggregates performance data into a unified view, enables marketers to analyse, optimise, and scale ads, and supports early detection of creative fatigue before performance collapses.
For user acquisition specialists in mobile gaming, this granularity is invaluable. You are working with a broad range of creative ad formats for marketers, from static banners to rewarded video to interactive playables. Each format behaves differently across platforms. A creative dashboard gives you a single analytical lens through which to evaluate all of them together.
The most capable dashboards also incorporate AI-assisted tagging. Rather than manually categorising each asset, the system reads visual and structural signals and attaches labels automatically: “gameplay hook,” “tutorial sequence,” “user-generated style,” “star character present.” This matters because it allows you to ask analytical questions at scale, such as which hooks generate the strongest first-five-second retention across all your active formats.
Key mechanics and features mobile marketers need
Understanding what a creative dashboard is and knowing what to demand from one are two different things. For mobile gaming user acquisition, certain features are non-negotiable.
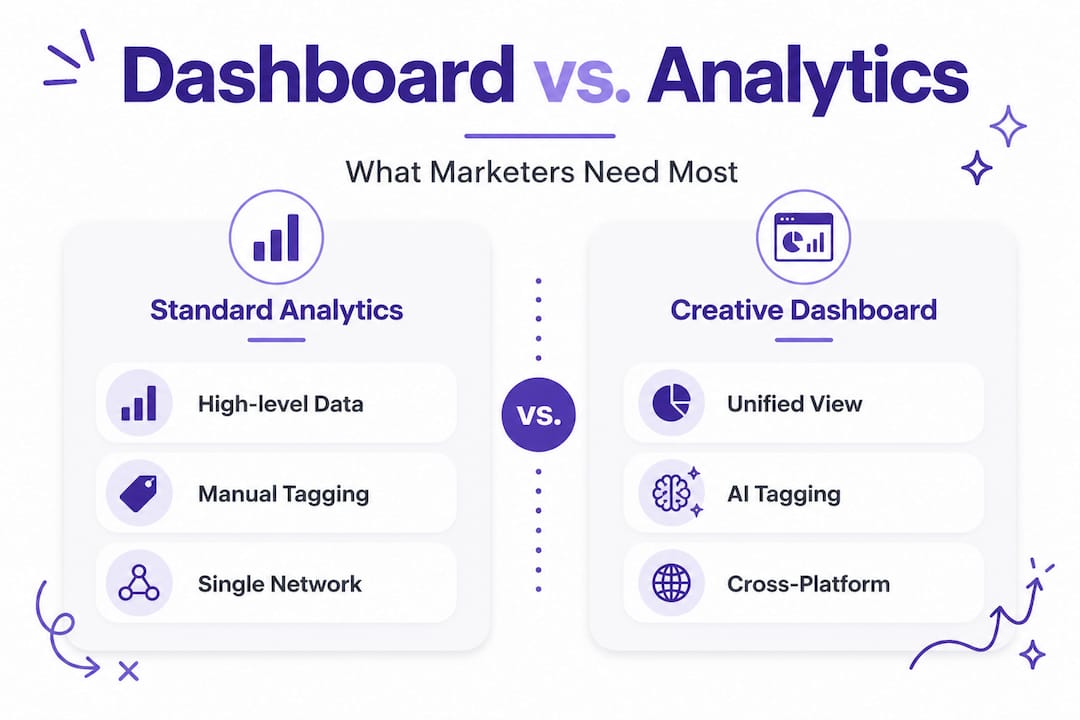
The table below contrasts essential creative dashboard capabilities against what you typically receive from a single-network analytics panel.
| Feature | Single-network analytics | Creative dashboard |
|---|---|---|
| Cross-platform data | No | Yes, unified |
| Asset-level breakdown | Limited | Full granularity |
| AI-powered creative tagging | No | Yes |
| Fatigue detection | No | Automated trend alerts |
| Creative comparison and grouping | No | Side-by-side and cohort views |
| Playable and interactive ad support | Rare | Included in leading tools |
| Custom metric combinations | Limited | Flexible |
Key dashboard mechanics include cross-platform data unification, asset-level granularity, AI-powered tagging, performance metrics visualisation, creative grouping and comparison, and fatigue detection via trend monitoring. These are not luxury features. For gaming UA at any meaningful scale, they represent the minimum viable analytical infrastructure.

The metrics you will track most closely include CTR (click-through rate), CPM (cost per mille), ROAS (return on ad spend), CPI (cost per install), IPM (installs per mille), and Day 7 retention. Each tells a different part of the story. IPM, for instance, is particularly revealing for playable ads because it measures how effectively a creative converts impressions to installs, cutting through inflated impression volumes that can mask weak performance.
When analysing playable ad metrics, it helps to work through a clear process rather than reacting to individual data points in isolation. Here is a practical framework:
- Link all active creative assets to your dashboard via platform APIs, ensuring no network is excluded.
- Tag every asset systematically, either through AI automation or manual labels covering format, hook type, character presence, and tone.
- Monitor performance trends over rolling seven-day windows, paying particular attention to IPM decay as a leading signal of fatigue.
- Iterate by pausing underperformers, scaling winners, and scheduling new creative variants before fatigue sets in.
Pro Tip: Use creative grouping and side-by-side comparison features to identify fatigue before your performance metrics drop sharply. When a cluster of similar assets all start showing declining IPM within the same week, that is your cue to refresh the hook or mechanic, not wait for ROAS to collapse.
Across mobile ad creative types, grouping by creative theme rather than just campaign allows pattern recognition at a level that single-network analytics simply cannot support.
How dashboards power creative testing and optimisation
With the mechanics clear, the real value of a creative dashboard becomes apparent in day-to-day testing and optimisation workflows. The contrast between manual and dashboard-led approaches is stark.
| Workflow element | Manual approach | Dashboard-led approach |
|---|---|---|
| Performance review frequency | Weekly or ad hoc | Daily with automated alerts |
| Insight source | Per-network exports | Unified, cross-platform view |
| Fatigue detection | Reactive, after decline | Proactive, via trend monitoring |
| Creative iteration speed | Slow, dependent on analyst bandwidth | Fast, flagged and prioritised automatically |
| Decision confidence | Low, data in silos | High, aggregated evidence |
| Testing methodology | A/B, single variable | Multi-variable with cohort comparison |
The practical implications are significant. When ad fatigue in gaming strikes, which it does faster in this vertical than in almost any other, a team operating from manual exports will often not notice until CPIs have already climbed 30% or more. A dashboard-equipped team catches the inflection point in the trend line and responds with a fresh creative variant before significant budget is wasted.
Several specific creative strategies consistently deliver strong results when surfaced through dashboard analysis:
- Failure-to-success narrative arcs that show a character failing before recovering tend to outperform straightforward win sequences, producing measurably stronger IPM uplift.
- User-generated content style gameplay reviews, even when produced professionally, consistently outperform polished studio-style ads in mobile gaming campaigns.
- Character-led hooks with recognisable traits outperform anonymous or purely aesthetic openers, particularly in the first three seconds of a video or playable.
- Short-form playable demos that let the user experience the core mechanic with one tap tend to drive higher quality installs with better Day 7 retention than equivalent video formats.
The data behind these patterns is compelling. Top creatives drive disproportionate spend, with failure-to-success arcs lifting IPM by 78% and UGC gameplay reviews lifting IPM by 88% compared to generic alternatives. Without a dashboard surfacing these patterns across all your campaigns simultaneously, you might discover one of these truths by chance. With a dashboard, you discover all of them systematically.
Ad fatigue in gaming hits faster than in other sectors, which means weekly creative refreshes are not simply best practice. They are a structural requirement for maintaining campaign efficiency. A well-configured dashboard makes that refresh cycle manageable by showing you exactly which assets are declining and giving you a prioritised list of what to address first.
For a practical view of what high-impact ad creative tips look like in execution, the combination of dashboard-surfaced patterns and rapid creative iteration is the most reliable path to consistent performance.
Handling challenges: edge cases and common pitfalls
Creative dashboards are not without their complications. Knowing the common pitfalls in advance allows you to configure your setup to minimise their impact.
The most frequently encountered challenges include:
- Missing visual previews: Not every platform API surfaces creative thumbnails or preview images consistently. This means you may have performance data without a visual reference for what the asset actually looks like, making it harder to connect analytical patterns to specific design decisions.
- Attribution gaps in cross-device journeys: A user who sees a playable ad on mobile but converts on tablet or desktop may not be captured correctly in your attribution window, understating the playable format’s true contribution.
- Tagging complexity for interactive formats: Static images and video are relatively straightforward to tag. Playable and interactive ads contain multiple interaction states, decision points, and mechanic layers. Tagging them accurately requires either sophisticated multimodal AI or a clear manual taxonomy, and neither is trivial to implement.
- Accelerated fatigue in gaming audiences: Gaming audiences are highly attentive and have seen enormous volumes of ads. Creative fatigue arrives faster in this context than in most verticals, meaning the detection and response cycle needs to be tighter than industry-average guidance would suggest.
Practical steps to address these issues include checking data integrity at the point of API connection, using your tagging taxonomy to compensate for missing visual previews, and building creative refresh schedules directly into your campaign planning rather than treating them as reactive tasks.
When optimising playable ads specifically, the tagging challenge is worth extra attention. Each playable has a tutorial phase, a core mechanic phase, and often a reward or outcome phase. Tagging each phase separately allows the dashboard to tell you which part of the interactive experience is driving or losing users.
Pro Tip: Refresh your gameplay asset groups every seven days regardless of whether performance has visibly declined. Gaming audiences are sensitive to repetition. By the time your metrics show clear fatigue, you have already lost several days of efficient spend. Proactive rotation is a far cheaper strategy than reactive repair.
Creating direct response ads that move users to action is also made measurably more reliable when you have dashboard data confirming which calls to action, visual treatments, and interactive moments are genuinely driving installs rather than simply generating impressions.
What most marketers miss about creative dashboards
There is a persistent assumption in mobile gaming marketing circles that the right analytics tool will solve the creative problem. Get the right dashboard, the thinking goes, and the data will tell you what to make. This assumption is worth questioning seriously.
Dashboards multiply your analytical capacity. They do not replace creative judgement. The most valuable insight a dashboard can surface, say, that failure-to-success emotional arcs outperform neutral gameplay demonstrations, still requires a human decision to act on it bravely. It requires a creative team willing to produce an ad where the player character fails repeatedly before succeeding, which feels counterintuitive to many brand stakeholders who prefer to show their game in the best possible light from the first frame.
Volume alone is insufficient. Diversification, emotional hooks, and platform-specific tailoring are essential elements of sustainable creative performance. Teams that use dashboards purely to scale what is already working, rather than to explore what could work, tend to plateau. The most effective UA teams use their dashboards to find the unexpected high performer, the under-budgeted creative variant that is punching above its weight on IPM, and then ask why it is working before they scale it.
The teams that see the biggest gains are not those with the most sophisticated dashboards. They are the ones asking braver questions of their data and then acting on the answers with creative discipline.
Following no-code ad creative trends also reveals that the barriers to creative experimentation are falling. When building a new playable variant no longer requires weeks of developer time, the iteration cycle that a dashboard demands becomes genuinely achievable for teams of all sizes.
Explore tools for better playable ad performance
Understanding the strategic value of creative dashboards is an important step. Putting that understanding into practice requires both the right analytics setup and the ability to produce fresh creative variants quickly enough to keep pace with your refresh schedule. Why playable ads work is grounded in psychology, but their practical advantage depends on how efficiently your team can build and iterate them. PlayableMaker exists to remove that bottleneck. Our no-code platform lets user acquisition teams build interactive playable ads without developer involvement, keeping production costs low and iteration speed high. When your dashboard flags that a creative hook needs refreshing, you can act on it the same day. Explore our cost-effective ad creation guide to see how teams are making this work in practice.
Frequently asked questions
How does an ad creative dashboard differ from a standard analytics dashboard?
Ad creative dashboards focus specifically on creative assets and their performance, providing asset-level granularity and AI-powered tagging that standard campaign dashboards do not offer. They reveal why a campaign performs rather than simply whether it does.
What performance metrics matter most for playable ad campaigns?
The most important metrics are CPI, IPM, ROAS, Day 7 retention, and CTR, as these directly measure user acquisition quality and ad engagement. Key metrics including CTR, CPM, ROAS, CPI, IPM, and Day 7 retention give the clearest picture of playable ad effectiveness.
How often should I refresh playable ad creatives to avoid fatigue?
Weekly refreshes are strongly recommended in mobile gaming. Ad fatigue arrives faster in gaming than in most other verticals, so a seven-day rotation cycle is a practical baseline rather than an aspirational target.
Can an ad creative dashboard track performance across all major platforms?
Yes, leading creative dashboards unify data from Meta, Google, TikTok, and other networks into a single performance view. Cross-platform data unification is a core mechanic of any capable creative analytics tool.
What unique challenges do dashboards face with playable ads?
Interactive and playable formats require multimodal tagging and workarounds for missing previews, but modern dashboards still deliver accurate performance data when configured correctly. Tagging each interaction phase separately is the most effective way to extract granular insight from playable formats.
Recommended
- Why Optimise Creatives for Playable Ads: Boost Engagement – playablemaker.com Why Optimise Creatives for Playable Ads: Boost Engagement
- Playable Ad Trends 2025: Build Engaging Ads Without Coding – playablemaker.com Playable Ad Trends 2025: Build Engaging Ads Without Coding
- Game Ad Engagement Techniques for Playable Ad Success – playablemaker.com Game Ad Engagement Techniques for Playable Ad Success
- Master the Playable Ad Optimisation Process for Success – playablemaker.com Master the Playable Ad Optimisation Process for Success
- Event data: the key to impactful marketing in 2026
