TL;DR:
- Creatives are responsible for about 56% of mobile app installs, surpassing targeting and bidding in impact. High-quality, diverse creative formats like playable ads significantly improve install rates and engagement by leveraging self-selection, but fatigue can set in within 7 to 10 days without proper refreshes. Building a structured, hypothesis-driven creative pipeline and ensuring alignment between ad and store experiences are essential for scalable, cost-efficient user acquisition in 2026.
Creatives are the single most powerful lever in mobile app user acquisition, responsible for approximately 56% of incremental installs according to internal Meta research. That figure exceeds the combined contribution of audience targeting, bidding strategy, and budget allocation. For user acquisition professionals in mobile gaming, this is not a peripheral concern. It is the central fact around which every campaign decision should be organised. Understanding why creatives drive installs, and how to act on that understanding, separates teams that scale efficiently from those that optimise everything except what actually matters.
Why do creatives outperform targeting and bidding for installs?
The dominance of creative quality over targeting precision has a structural explanation. Apple’s App Tracking Transparency framework and the deprecation of Google’s Advertising ID have significantly narrowed the signal pool available to advertisers. When targeting capabilities converge across competing campaigns, the creative becomes the primary differentiator that platform algorithms use to determine relevance and delivery. Meta’s and Google’s machine learning systems now optimise heavily towards engagement signals embedded in the creative itself, including scroll-stop rate, interaction depth, and completion rate. Creative is no longer just the message. It is the targeting mechanism.
The financial consequences of ignoring this are measurable. Two campaigns identical in budget and targeting can produce a 500% to 800% difference in cost per install, driven entirely by creative execution. That range is not a theoretical edge case. It reflects the real variance RocketShip HQ observed across mobile advertisers in 2026. A team spending £50,000 per month on a poorly performing creative set could achieve the same install volume for under £10,000 with superior creative. The inverse is equally true: strong creatives compound returns at scale.
Creative is the new targeting. In a post-privacy advertising environment, the algorithm reads your creative to decide who sees it. The quality of that signal determines your auction position, your delivery, and ultimately your cost per install.
Platform algorithms reward creative volume and variation for a specific reason. When a single creative exhausts its audience, the algorithm has nowhere to go. Diverse creative rotation gives the system more signals to work with, enabling it to find new audience segments without requiring expanded targeting parameters. This is why creative scalability functions like an engineering pipeline rather than a campaign line item. Teams that treat it as infrastructure consistently outperform those that treat it as an afterthought.
How do playable ads compare to video and static for install rates?

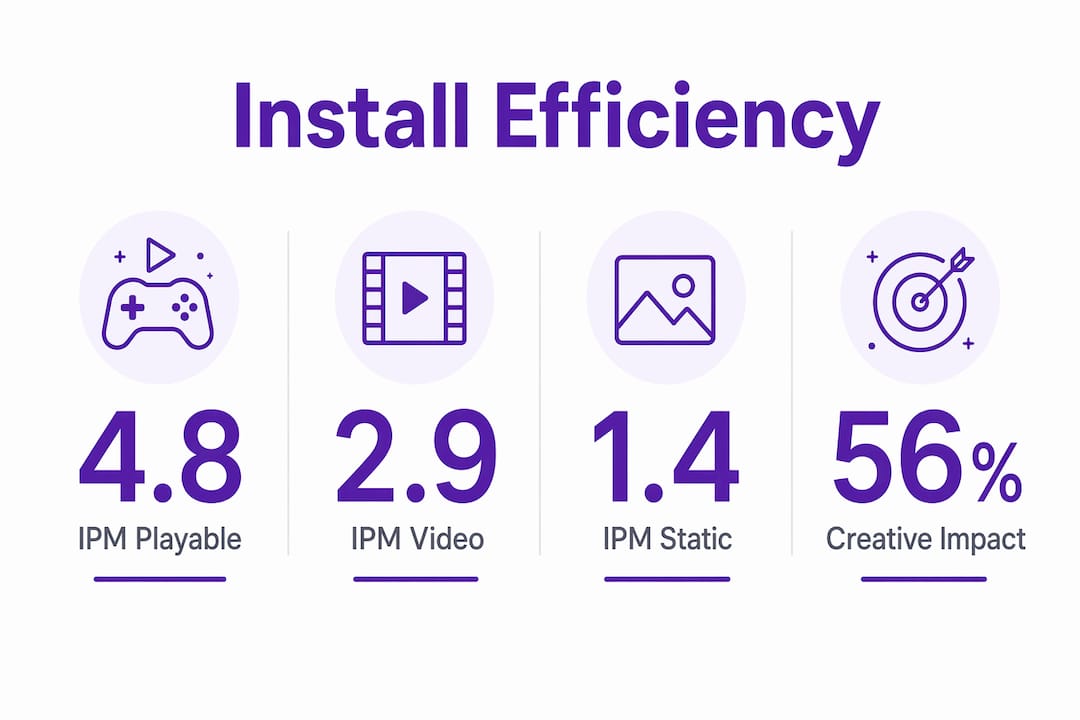
Format selection has a direct and quantifiable impact on install efficiency. Playable ads average 4.8 installs per mille (IPM) compared to 2.9 for video and 1.4 for static formats, according to Liftoff data summarised by RocketShip HQ. That gap is not marginal. A playable ad delivers more than three times the install rate of a static banner at equivalent impression volume, which has a direct effect on effective cost per install across a campaign.
The psychological mechanism behind this performance is self-selection. A playable ad functions as a miniature version of the game itself, allowing users to experience core mechanics before committing to a download. Users who complete the playable interaction and then tap the install CTA have already demonstrated intent. They are not responding to a promise. They are responding to an experience they have just had. This pre-qualification effect is why playable ads enhance install intent and downstream retention simultaneously. The user who installs after a playable is more likely to engage post-install, which improves the quality signal fed back into the algorithm.
| Format | Average IPM | Relative install efficiency |
|---|---|---|
| Playable ads | 4.8 | Highest |
| Video ads | 2.9 | Mid-range |
| Static ads | 1.4 | Lowest |
Effective playable ads share several structural characteristics. Fast pacing in the first three seconds prevents drop-off before the interactive element loads. Challenge-reward loops within the mini-game create a brief but genuine sense of progression. The call-to-action appears at the moment of peak engagement, typically immediately after the user completes a satisfying in-game action. Each of these elements is deliberate, not decorative.
Pro Tip: Design your playable’s fail state intentionally. A well-crafted near-miss moment, where the user almost succeeds, generates stronger install motivation than an easy win. The desire to try again on the full game is a powerful conversion trigger.
Playable ads are most effective for gaming apps distributed through channels that support rich media formats, including Meta’s Audience Network, Google App Campaigns, and ironSource. Their impact is less pronounced for utility or productivity apps, where the interactive preview has less natural content to draw from.
Why must ad creatives align with the install experience?
Creative-to-store alignment is one of the most consistently underestimated factors in install conversion. Misalignment between ad CTA and install experience reduces downstream conversion even when the initial ad click rate is strong, as Google’s 2026 guidance makes clear. A user who taps an ad expecting one experience and encounters a different one on the store page does not install. They leave. The click is wasted and the CPI calculation absorbs the cost without the corresponding install.
Google’s guidance on install-focused CTA language is specific: phrases such as “Download now” and “Play now” outperform generic alternatives because they set accurate expectations about the action the user is about to take. This matters beyond semantics. When the CTA language matches the store page action and the creative visuals match the app’s actual interface, the user experiences a coherent journey. Coherence reduces friction, and reduced friction increases conversion.
Practical alignment principles for UA teams include:
- Match the visual style of the ad creative to the app store screenshots and icon, so the user recognises the product across touchpoints.
- Use the same character, level, or game mechanic featured in the ad as the lead visual on the store listing.
- Avoid depicting features or content not present in the current version of the app, as this creates expectation gaps that generate negative reviews and reduce organic conversion.
- Test store page variants alongside creative variants, treating them as a single conversion unit rather than separate optimisation tasks.
Pro Tip: Run a creative-to-store audit quarterly. Pull your top five performing creatives and compare each one directly against your current store listing. If a new team member cannot immediately identify which creative belongs to which app, your alignment has drifted.
Consistent user expectations across the ad and store experience are directly linked to better conversion rates, according to Playio’s 2026 analysis. The store page is not a separate marketing asset. It is the final stage of the creative funnel.
How does creative fatigue affect install campaign performance?
Creative fatigue is the performance degradation that occurs when a specific creative has been shown to the same audience segment repeatedly, reducing novelty and engagement. Fatigue typically sets in within 7 to 10 days, producing CTR drops of 15% or more and corresponding CPI spikes, according to Soku AI’s 2026 analysis. For a campaign running at scale, a 15% CTR decline within the first fortnight is not a minor fluctuation. It is a signal that the creative is exhausting its audience and that the algorithm is beginning to penalise delivery.
The mechanism extends beyond simple audience saturation. Creative fatigue degrades auction quality scores, which inflates CPI across the entire ad set, not just the fatigued creative. This means a single underperforming creative can raise costs for every other creative in the campaign. Active creative management is therefore a bidding efficiency issue as much as a creative quality issue.
Effective mitigation follows a structured sequence:
- Establish a baseline refresh cadence before launch. Plan new creative concepts at two to four week intervals rather than reacting to performance drops after they occur.
- Monitor frequency metrics alongside CTR. Rising frequency combined with declining CTR is the earliest reliable indicator of fatigue onset.
- Retire creatives proactively at defined performance thresholds, not when they reach zero engagement. Waiting for complete exhaustion wastes budget and suppresses algorithm learning.
- Introduce concept-level variation, not just cosmetic changes. Swapping a background colour or changing a subtitle does not reset fatigue. New hooks, new mechanics, and new narrative angles do.
- Maintain a creative backlog of at least four to six untested concepts at all times, so refresh cycles do not create delivery gaps.
Digital ad campaign best practices for 2026 consistently emphasise planned rotation over reactive replacement as the more cost-efficient approach. Reactive management means you are always responding to a problem that has already cost you money.
What frameworks help UA teams build a high-output creative pipeline?
Treating creative production as infrastructure rather than a campaign deliverable changes how teams allocate time, budget, and testing capacity. Profitable Meta-centric UA accounts produce 15 to 40 new creative concepts monthly and refresh top performers every two to four weeks, according to Admiral Media’s 2026 agency data. That volume is not achievable through ad hoc production. It requires a systematic pipeline with defined roles, testing protocols, and decision criteria.
A well-structured creative pipeline for mobile gaming UA operates on several principles:
- Hypothesis-driven testing: Every new creative concept should be built around a specific hypothesis about user motivation, for example, “users respond to competitive ranking mechanics more than narrative progression.” Testing without a hypothesis produces data without insight.
- Hook diversity as a primary variable: The first three seconds of any creative determine whether the user continues watching. Diverse hook angles backed by data produce better compound performance than iterating on a single winning hook. Test gameplay hooks, social proof hooks, challenge hooks, and curiosity hooks as distinct concept categories.
- Platform-specific variants: A creative optimised for Meta’s feed performs differently on TikTok or Google’s App Campaigns. Build platform variants into the production brief, not as an afterthought.
- Significance thresholds before scaling: Do not scale a creative based on early positive signals. Define minimum impression and install thresholds before a concept is considered validated, and apply those thresholds consistently.
Pro Tip: Separate your creative testing budget from your scaling budget at the account level. When testing and scaling share the same budget, teams unconsciously under-invest in testing to protect short-term ROAS. Dedicated testing budgets produce better long-term creative libraries.
Optimising only for installs risks attracting low-intent users who inflate volume without contributing to retention or revenue. Integrating post-install value events, such as tutorial completion or first purchase, into the optimisation signal produces a higher-quality install base and improves the feedback loop between creative performance and business outcomes.
Key takeaways
Creative quality is the dominant variable in mobile app install performance, outweighing targeting, bidding, and budget in measurable impact.
| Point | Details |
|---|---|
| Creative drives 56% of installs | Meta research confirms creative outperforms targeting and budget as an install driver. |
| Playable ads deliver 4.8 IPM | Interactive formats produce more than three times the install rate of static ads at equivalent impressions. |
| Fatigue onset within 7 to 10 days | CTR drops of 15% or more signal fatigue; planned refresh cycles prevent CPI inflation. |
| Creative-to-store alignment matters | Consistent visuals and CTA language across ad and store page reduce friction and lift conversion. |
| Volume and variation sustain performance | Producing 15 to 40 new concepts monthly and rotating regularly prevents algorithm learning suppression. |
Creative strategy in 2026: what I have actually observed
The data on creative dominance is now well-established, but the practical reality I observe is that most UA teams still treat creative as a support function rather than the primary growth lever. Teams will spend weeks refining audience segmentation and bidding logic while running the same three creatives for two months. The irony is that the targeting work they are doing is largely redundant. The algorithm is already doing it for them, using the creative as its primary input signal.
The teams I see scaling efficiently in 2026 share one characteristic: they have accepted that creative velocity is a competitive advantage in the same way that bid efficiency once was. They produce more concepts, test more hypotheses, and retire underperformers faster than their competitors. They also understand that playable ads convert better not because of novelty but because of the self-selection mechanism. Users who install after an interactive experience are fundamentally different from users who install after a passive video impression.
The common pitfall I see is under-investment in creative diversity. Teams find one winning concept and iterate on it cosmetically until it is exhausted, then scramble to replace it. A creative library built on a single winning angle is fragile. The teams that sustain install efficiency build libraries across multiple hook categories, multiple gameplay mechanics, and multiple emotional registers. Experimentation is not a luxury. It is the mechanism by which you discover what your next winning concept is before your current one runs out.
— Ondrej
Build better playable ads with Playablemaker
If the evidence above has clarified where your creative investment should go, the next practical question is how to produce playable ads at the volume and speed that a high-output pipeline requires. Playablemaker is built specifically for this problem. The platform lets UA teams create interactive playable ads without writing a line of code, removing the developer dependency that makes playable production slow and expensive for most teams. You can read more about the psychology behind playable ad effectiveness to understand why the format works, then use Playablemaker to build and test concepts at the cadence your campaigns actually require.
FAQ
Why do creatives have more impact on installs than targeting?
Creatives drive approximately 56% of incremental installs according to Meta research, exceeding the contribution of audience targeting and bidding combined. In the post-ATT environment, platform algorithms use creative engagement signals to determine delivery, making the creative the functional equivalent of targeting.
What IPM can playable ads achieve compared to video?
Playable ads average 4.8 installs per mille versus 2.9 for video and 1.4 for static formats, based on Liftoff data. This performance advantage stems from the self-selection effect: users who complete an interactive experience before installing demonstrate higher intent.
How quickly does creative fatigue set in on install campaigns?
Creative fatigue typically occurs within 7 to 10 days, producing CTR drops of 15% or more and CPI spikes. Planned refresh cycles at two to four week intervals are more cost-efficient than reactive replacement after performance has already declined.
How many new creatives should a UA team produce each month?
Profitable Meta-centric accounts produce 15 to 40 new creative concepts monthly and refresh top performers every two to four weeks, according to Admiral Media’s 2026 agency data. This volume requires treating creative production as a structured pipeline rather than a campaign task.
Does aligning the ad creative with the store page affect install rates?
Consistent visuals and CTA language between the ad and the app store listing reduce expectation gaps that cause users to abandon the install journey after clicking. Aligned creative-to-store experiences directly improve conversion at the final stage of the install funnel.
Recommended
- 2025 SocialPeta & Newsbreak Mobile Game Report: 9M+ Monthly Advertisers & the Rise of Weekly Creative Iteration – playablemaker.com 2025 SocialPeta & Newsbreak Mobile Game Report: 9M+ Monthly Advertisers & the Rise of Weekly Creative Iteration
- Why Creatives Matter for Mobile Game Ad Success – playablemaker.com Why Creatives Matter for Mobile Game Ad Success
- Mobile creatives: a practical guide for marketers – playablemaker.com Mobile creatives: a practical guide for marketers
- Creativity in mobile advertising: how playable ads win – playablemaker.com Creativity in mobile advertising: how playable ads win