
Playable ad click-through rate is one of those metrics that looks straightforward on the surface but consistently trips up even experienced mobile gaming marketers. Many UA professionals track it religiously yet misinterpret what the numbers actually mean, comparing figures across formats or platforms without accounting for context. This guide cuts through that confusion. You will find precise definitions, current industry benchmarks, the creative and technical levers that move the needle, and a structured framework for continuous optimisation. Whether you are running hypercasual campaigns or managing a mid-core RPG portfolio, understanding playable ad CTR properly is foundational to improving your user acquisition ROI.
Table of Contents
- What is playable ad CTR?
- Industry benchmarks for playable ad CTR
- What shapes playable ad CTR: Creative and technical factors
- Game genre, ad length, and complexity: Edge cases that shift playable CTR
- Advanced tactics: Analysing and optimising your playable ad CTR
- How PlayableMaker helps you master playable ad CTR
- Frequently asked questions
Key Takeaways
| Point | Details |
|---|---|
| CTR definition | Playable ad CTR shows the percentage of users who click through after interacting with your ad. |
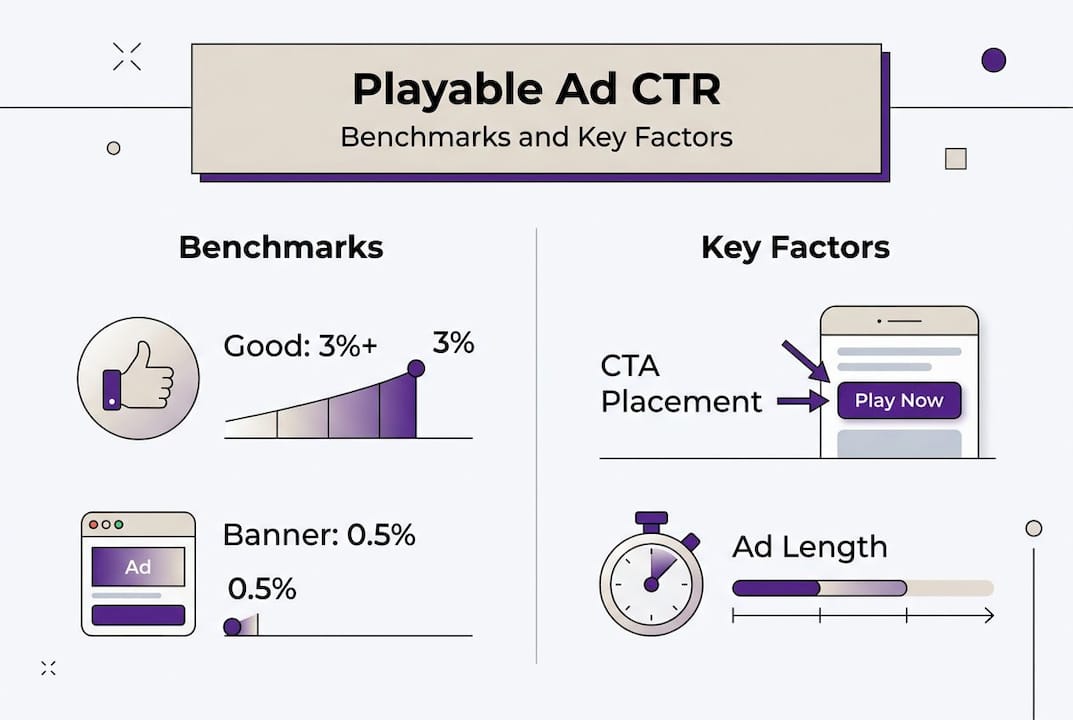
| Industry benchmarks | A CTR above 3 percent is considered strong for playable ads in mobile games. |
| Creative factors | Short, clear playables and central CTA placement reliably increase CTR. |
| Segment and optimise | Analyse both overall and segmented CTR to uncover optimisation opportunities. |
| Tools for success | Frameworks and no-code tools streamline testing and performance gains for UA teams. |
What is playable ad CTR?
Before optimising any metric, you need to define it precisely. Playable ad CTR is the Click-Through Rate for playable ads, calculated as (Clicks / Impressions) x 100, measuring the percentage of users who click the ad (typically to install the game) after viewing it in mobile gaming UA campaigns.
In plain terms: if 10,000 users see your playable ad and 350 click through to install, your CTR is 3.5%. Simple enough. But the confusion starts when marketers conflate CTR with engagement rate. Engagement rate measures how many users actually interact with the playable experience itself. CTR measures how many proceed to click the install button. These are related but distinct signals.
Why does this distinction matter? Because optimising for the wrong metric wastes budget. A playable ad with a 60% engagement rate but a 1.5% CTR suggests the experience is entertaining but failing to convert interest into action. When analysing playable ad metrics, treating these two figures as interchangeable leads to misguided creative decisions.
Here is what CTR actually tells you in a UA context:
- Creative appeal: Does the ad hook users enough to act?
- Audience alignment: Is the ad reaching users predisposed to install?
- CTA effectiveness: Is the call-to-action visible, compelling, and well-timed?
- Campaign efficiency: Are impressions converting into meaningful downstream actions?
Tracking ad performance metrics in isolation is a common pitfall. CTR gains meaning when read alongside IPM (installs per mille) and retention data.
Absolute CTR numbers without context are almost meaningless. A 4% CTR on a broad audience network is very different from a 4% CTR on a tightly targeted retargeting segment. Always contextualise.
Industry benchmarks for playable ad CTR
Now that you know what CTR is and why it matters, it is crucial to understand what a strong result actually looks like across different platforms and contexts.
According to industry data, a good playable CTR sits at approximately 3% or above, with figures below 3% typically triggering a creative review. On Facebook specifically, the expected range runs from 2.5% to 4%, reflecting the platform’s relatively mature playable ad ecosystem.
For broader context, playable ads consistently outperform standard banner and static interstitial formats. Banners typically achieve CTRs well below 1%, while video ads without interactive elements average around 1 to 2%. The interactivity of playable formats is a core driver of this performance gap. You can explore the benefits of playable ads in more detail to understand why engagement translates so directly into higher CTR.
| Ad format | Typical CTR range |
|---|---|
| Banner ads | 0.1% to 0.5% |
| Static interstitials | 0.5% to 1.5% |
| Video ads (non-interactive) | 1% to 2% |
| Playable ads | 2.5% to 5%+ |
| Facebook playable ads | 2.5% to 4% |
For Facebook ad CTR benchmarks specifically, the 2.5 to 4% range reflects a competitive but achievable target for well-optimised creatives. Falling below 2% on Facebook is a clear signal that either the creative or the targeting needs attention.
Key takeaway: Use 3% as your baseline threshold. Anything above it warrants scaling; anything below it warrants investigation.
What shapes playable ad CTR: Creative and technical factors
Knowing the benchmarks, the logical next question is: which levers can you actually pull to move CTR in the right direction?
Creative and technical decisions both play a significant role. One of the most impactful findings from optimisation research is that CTA placement alone can boost CTR by 47% when positioned centrally rather than at the edges of the screen. That is a substantial lift from a single design decision.

Lead-in video also matters considerably. A short, high-energy video clip before the interactive segment primes users and increases the likelihood they will engage with the playable portion and ultimately click through. Interactive video engagement research supports the principle that priming users with visual context before asking them to act improves conversion rates meaningfully.
Here are the primary creative and technical factors to prioritise:
- CTA position: Centre placement outperforms edge placement by up to 47%
- Lead-in video: A 3 to 5 second hook before gameplay increases engagement and CTR
- Win vs lose scenarios: Testing whether users win or lose the mini-game affects CTR; winning scenarios often convert better but this varies by genre
- Engagement rate threshold: Aim for engagement rates above 20 to 35% before expecting strong CTR
- Visual simplicity: Cluttered interfaces reduce interaction and suppress CTR
- Load time: Ads that take longer than 3 seconds to load see significant engagement drop-off
For playable ad A/B testing, the golden rule is to test one variable at a time. Changing CTA position and lead-in video simultaneously makes it impossible to attribute performance shifts accurately.
Pro Tip: Before testing CTA copy or colour, first confirm your CTA is centred. It is the highest-impact, lowest-effort change available and should be your starting point for any CTR optimisation effort.
Game genre, ad length, and complexity: Edge cases that shift playable CTR
Beyond universal creative principles, genre, duration, and gameplay complexity exert their own distinct influence on CTR. These variables are often underestimated in planning.
Hypercasual games account for 13% of playable ad usage compared to just 1% for RPGs, and this disparity reflects a fundamental truth about the format. Hypercasual mechanics are simple, immediately gratifying, and easy to replicate in a 15 to 30 second playable format. RPG mechanics, by contrast, require context, progression, and narrative investment that a short ad cannot adequately convey.
Complexity is the enemy of CTR in playable ads. When users encounter controls or objectives they cannot grasp within the first few seconds, they disengage rather than click through. Keeping the interactive loop simple and the total ad duration under 45 seconds is not just a best practice; it is a measurable performance driver.
Load time is a silent CTR killer. Ads that exceed 3 seconds to load lose a significant portion of their potential audience before the experience even begins. Optimise asset sizes and delivery accordingly.
Genre-specific considerations worth noting:
| Genre | Playable ad suitability | CTR tendency |
|---|---|---|
| Hypercasual | Very high | Higher CTR, simple loop |
| Puzzle | High | Moderate to high CTR |
| Mid-core strategy | Moderate | Lower CTR, needs strong hook |
| RPG | Low | Lowest CTR, complex to convey |
For deeper analysis of how these variables interact, analysing playable ad engagement across genre segments provides a clearer picture of where your specific title sits. Personalised ad engagement research also suggests that tailoring the playable experience to audience segments can partially offset the CTR disadvantage in more complex genres.
Advanced tactics: Analysing and optimising your playable ad CTR
With the influential variables mapped out, the next step is building a structured, repeatable process for CTR improvement rather than relying on ad hoc testing.
One of the most valuable but underused analytical approaches is segmenting CTR by outcome scenario. Specifically, tracking %win CTR vs %lose CTR allows you to understand how difficulty perception affects conversion. A user who wins the mini-game may feel positively primed to install; a user who loses may feel motivated by the challenge or, conversely, put off. The optimal balance varies by genre and audience, which is why tracking both figures separately is essential.
Here is a structured framework for continuous CTR optimisation:
- Establish your baseline: Record current CTR segmented by platform, placement, and audience segment
- Identify the weakest variable: Use your A/B test steps framework to prioritise which element to test first
- Isolate one variable: Change only one element per test cycle, whether that is CTA position, lead-in video, or win/lose ratio
- Run for statistical significance: Do not call a test early; ensure sufficient impressions before drawing conclusions
- Document and iterate: Record every result, including negative outcomes, and feed learnings into the next creative iteration
- Monitor engagement rate alongside CTR: If engagement rate drops below 20%, address that before expecting CTR to recover
Common analytical pitfalls include comparing CTR across different ad networks without normalising for audience quality, and treating a single high-CTR result as definitive without replication. Measuring playable ad effectiveness requires a longer view than a single campaign cycle.
Pro Tip: Track important video metrics such as completion rate and interaction depth alongside CTR. A high CTR paired with low post-install retention often signals that the playable ad is misrepresenting the core game loop, which is a creative alignment problem, not a CTR problem.
The most effective UA teams treat CTR optimisation as a continuous cycle rather than a one-time fix. Each test informs the next creative brief, building institutional knowledge about what resonates with your specific audience.
How PlayableMaker helps you master playable ad CTR
Optimising playable ad CTR does not have to mean lengthy development cycles or expensive creative iterations. PlayableMaker is built specifically for mobile gaming marketers who need to move fast without sacrificing quality. The platform’s no-code tools let you build, test, and iterate on playable ads without pulling developer resources, which means you can run the single-variable A/B tests this guide recommends at a pace that actually keeps up with campaign demands. If you are still building the case internally for why the format works, playable ads explained and why playable ads are effective offer the evidence-backed context you need. The result is faster creative cycles, lower production costs, and CTR data you can act on immediately.
Frequently asked questions
How do you calculate playable ad CTR?
Playable ad CTR is calculated as (Clicks divided by Impressions) multiplied by 100, giving you the percentage of users who clicked after seeing the ad.
What CTR is considered good for playable ads in mobile games?
A good playable ad CTR starts at approximately 3% or higher. On Facebook, the typical benchmark range is 2.5% to 4%, and figures below 3% generally warrant a creative review.
Does game genre affect playable ad CTR?
Yes, significantly. Hypercasual games see far higher playable ad usage and CTR than RPGs or complex genres, primarily because their mechanics translate more naturally into short interactive formats.
Which aspect of playable ad design most impacts CTR?
CTA placement has the single largest measurable impact. A centred CTA can lift CTR by up to 47% compared to edge-positioned alternatives, making it the first design element to audit in any underperforming campaign.
How can I improve underperforming playable ad CTR?
Start by auditing CTA placement, then shorten the ad to under 45 seconds if needed. Test one variable at a time and segment your results by %win CTR to understand how difficulty perception is influencing conversion behaviour.
Recommended
- What Is a Good Facebook Ad CTR? Complete Guide – playablemaker.com What Is a Good Facebook Ad CTR? Complete Guide
- What’s a Good CTR for Facebook Ads Success – playablemaker.com What’s a Good CTR for Facebook Ads Success
- 8 Key Ad Performance Metrics for Mobile Gaming Success – playablemaker.com 8 Key Ad Performance Metrics for Mobile Gaming Success
- Master the Playable Ad Optimisation Process for Success – playablemaker.com Master the Playable Ad Optimisation Process for Success
